Audit Committee The Audit Committee has the most direct and systematic responsibility for overseeing risk management. The Audit Committee charter provides for a variety of regular and recurring responsibilities relating to risk, including: • having responsibility for the internal audit function, with that function having a direct line of communication to the
Audit Committee; • receiving reports from management and the internal audit function regarding the adequacy and effectiveness of various internal controls; • reviewing periodically with internal counsel legal and regulatory matters that could have a significant impact on us and could indicate emerging areas of risk; • overseeing accounting and risk management processes, including receiving regular reports from our Chief Legal Officer; and • discussing with management our guidelines and policies with respect to risk assessment and enterprise risk management, including our major risk exposures and the steps management has taken to monitor and control such exposures. In performing these functions, the Audit Committee regularly receives reports from management (including the Chief Executive Officer, the Chief Financial Officer, the Controller and the Chief Legal Officer) and internal auditors regarding our risk management program (which incorporates our compliance, information & cyber security, and business continuity programs), extraordinary claims and losses, and significant litigation. The Board receives updates on risk oversight from the Audit Committee and members of management. | | Compensation Committee The Compensation Committee oversees our compensation policies and practices and has assessed whether our compensation policies encourage excessive risk-taking. The Compensation Committee has concluded that these policies and practices are not reasonably likely to have a material adverse effect on us. In arriving at that conclusion, the Compensation Committee considered, among other factors: Although risk oversight permeates many elements of the work of the full Board and the committees, the Audit Committee has the most direct and systematic responsibility for overseeing risk management. The Audit Committee charter provides for a variety of regular and recurring responsibilities relating to risk, including:
- •
having responsibility for the internal audit function, with that function having a direct line of communication to the Audit Committee;
•receiving reports from management and the internal audit function regarding the adequacy and effectiveness of various internal controls;
•reviewing periodically with internal counsel legal and regulatory matters that could have a significant impact on us and could indicate emerging areas of risk;
•overseeing our risk program with respect to legal and regulatory requirements and risks, including receiving regular reports from our Chief Risk Officer; and
•discussing with management our guidelines and policies with respect to risk assessment and risk management, including our major risk exposures and the steps management has taken to monitor and control such exposures.
In performing these functions, the Audit Committee regularly receives reports from management (including the Chief Executive Officer, the Chief Financial Officer, the Controller, the General Counsel and the Chief Risk Officer) and internal auditors regarding our risk management program (including our compliance
Table of Contents
program, information security and business continuity programs), extraordinary claims and losses, and significant litigation.
Separately, the Compensation Committee oversees our compensation policies and practices and has assessed whether our compensation policies encourage excessive risk taking. The Compensation Committee has concluded that these policies and practices are not reasonably likely to have a material adverse effect on us. In arriving at that conclusion, the Compensation Committee considered, among other factors, the metrics used to determine variable compensation;
• the portion of variable compensation paid in equity, which is either time-vested or tied to the achievement of long-term Company objectives; • the amount of compensation paid as sales commissions and the number of people to whom such compensation is paid; and • controls, such as pricing limits, a recoupment policy and financial reconciliation processes for sales crediting, quality checks that we employ and the approval process for certain compensation-related activities.
Board Meetings and Attendance
|
Board Meetings and Attendance Our Board held six meetings during 2016.2018 and ournon-management directors also met five times in executive session without management present. Each director attended 75% or more of the total number of meetings of the Board and meetings of the committees (if any) on which the director served during his or her respective tenure on the Board.Board during 2018. From time to time, our Board and committees also actsact by unanimous written consent as permitted by our Bylaws and the Delaware General Corporation Law. Retention of Outside Advisors Retention of Outside Advisors
|
The Board and all of its committees have authority to retain outside advisors and consultants that they consider necessary or appropriate in carrying out their respective responsibilities. The independent accountants are retained by, and report directly to, the Audit Committee. In addition, the Audit Committee is responsible for the selection, assessment, and termination of the internal auditors to which we have outsourced our internal audit function. Similarly, the consultant retained by the Compensation Committee to assist in the evaluation of senior executive compensation reports directly to that committee.
Code of Conduct The Board has adopted a codeCode of ethicsConduct (the “Code”) that applies to all employees, including our principal executive officer, principal financial officer, principal accounting officer or controller,directors, Chief Executive Officer, Chief Financial Officer, Controller, and persons performing similar functions. A copy of this code of ethics is posted on the Investors section of our web site under Leadership & Governance — Highlights atwww.corelogic.com. The Board also has adopted a broader code of ethics and conduct, applying to all employees, officers and directors,functions, which also has been posted under "Investors — “Investors—Leadership & Governance — Highlights"Governance—Highlights” on our web site at the address stated above.websitewww.corelogic.com. If we waive or amend any provisions of these codes of ethicsthe Code that apply to our directors and executive officers, including our principal executive officer, principal financial officer, principal accounting officer, or controllerChief Executive Officer, Chief Financial Officer, Controller and persons performing similar functions, we will disclose such waivers or amendments on our web site,website, at the address and location specified above, to the extent required by applicable SEC and NYSE Rules.rules. Corporate Governance Guidelines Corporate Governance Guidelines
|
The Board has adopted Corporate Governance Guidelines which have been posted under “Investors—Leadership & Governance—Highlights” on the Investors section of our web site under Leadership & Governance — Highlights atwebsitewww.corelogic.com. In addition to stating the standards that the Board applies in determining whether or not its members are independent, these guidelines stateaddress, among other items, the qualifications and responsibilities of our directors and describe fundamental aspects of our Board and certain of its committees.
Table of ContentsDirector Overboarding Policy
Director Overboarding Policy
|
Our Corporate Governance Guidelines provide that our directors may not serve on more than five public company boards (including our Board), and our Audit Committee members may not serve on more than three public company audit committees (including our Audit Committee), in each case, without prior Board approval. In each case, in determining whether to grant such approval, the Board will consider the director'sdirector’s ability to devote sufficient time to the activities of the Board and/or Audit Committee and the director'sdirector’s qualifications and contribution, or potential contribution, to the Board and/or Audit Committee. AllAs of the date of this proxy statement, all of our directors are in compliance with the overboarding policy. Board and Committee Evaluations Board and Committee Evaluations
|
To increase their effectiveness, the Board and each of its committees perform an annualself-evaluation under the direction of the Nominating and Corporate Governance Committee. The evaluation addresses, among other items, attendance, preparedness, participation, candor and other measures of performance selected by the Board. Director Attendance at Annual Meetings Director Attendance at Annual Meetings
|
We encourage our directors to attend the annual meetings of our stockholders, either in person or telephonically. All of our nineeleven directors nominated for election in 2017 attended the 20162018 annual meeting. Communicating with Directors Communicating with Directors
|
Stockholders and other interested parties may communicate directly with members of the Board, including the Chairman of the Board or any of the othernon-management directors of our Company (individually or as a group), by writing to such director(s) at: Our Corporate Secretary reviews and promptly forwards communications to the directors, as appropriate. Communications involving substantive accounting or auditing matters are forwarded to the Chair of the Audit Committee. Certain items that are unrelated to the duties and responsibilities of the Board will not be forwarded such as: business solicitation or advertisements;product- orservice-related inquires; junk mail or mass mailings; resumes or otherjob-related inquires; and spam and overlyinappropriately hostile, threatening, potentially illegal or similarly unsuitable communications. Directors receiving communications will respond as such directors deem appropriate, including the possibility of referring the matter to management of our Company, to the full Board or to an appropriate committee of the Board. Transactions with Management and Others Transactions with Management and Others
|
The Board has adopted a written policy regarding transactions with related persons that requires the approval or ratification by the Board or the Nominating and Corporate Governance Committee of any transaction exceeding $120,000 in which we are a participant and any related person has a direct or indirect material interest. A related person includes a director, nominee for election as a director, executive officer, person controlling over 5% of our common stock and the immediate family members of each of these individuals. Once a transaction has been determined to require approval, the transaction will be reviewed and approved by either the Board or the Nominating and Corporate Governance Committee. The Board or the Nominating and Corporate Governance Committee will review and consider the terms, business purpose and benefits of the transaction to usthe Company and the related person.
Table of Contents
If a related party transaction is notpre-approved, then it must be brought to the Board or the Nominating and Corporate Governance Committee for ratification as promptly as possible. No member of the Board or the Nominating and Corporate Governance Committee may participate in the review or approval of a related party transaction in which he or she has a direct or indirect interest, unless the Chairman of the Board or the chairperson of the Nominating and Corporate Governance Committee requests such individual to participate. The following types of transactions do not requirepre-approval: •compensatory arrangements for service as an officer or director of ours, provided such compensation is approved by the Compensation Committee;
•transactions between us and our affiliates (other than directors and officers);
•transactions involving a related person with only an indirect interest resulting solely from ownership of less than 10% of, or being a director of, the entity entering into a transaction with us;
•ordinary course transactions involving annual payments of $100,000 or less; or
•transactions involving indebtedness between us and a beneficial owner of more than 5% of our common stock or an immediate family member of such beneficial owner, provided that the beneficial owner or family member is not an executive officer, director or director nominee of ours or an immediate family member thereof. We have entered into the transactions discussed below, which have been approved or ratified in accordance with our related party transactions policy.
Price Associates beneficially owns greater than 5% of our common stock and is therefore a related party. During 2016, Price Associates or its affiliates purchased approximately $208,000 of data, analytics and other Company products. These transactions occurred pursuant to contracts entered into on an arm's-length basis and were ratified by the Nominating and Corporate Governance Committee in accordance with our related party transactions policy.
BlackRock, Inc. beneficially owns greater than 5% of our common stock and is therefore a related party. During 2016, BlackRock, Inc. or its affiliates purchased approximately $395,000 of data, analytics and other Company products. These transactions occurred pursuant to contracts entered into on an arm's-length basis and were ratified by the Nominating and Corporate Governance Committee in accordance with our related party transactions policy.
Table of Contents
DIRECTOR COMPENSATION The following table sets forth certain information concerning the compensation of our directors other than Mr. Martell for the fiscal year ended December 31, 2016.2018. | | | | | | | | | | | | | | | | | | | | | | | | | | | | | | | | | | | | | | | | | | | | Name |
| | |
| Fees Earned or
Paid in Cash
($) |
| | |
| Stock
Awards(1)(2)
($) |
| | |
| Total
($) |
| | | | | | | | | | | | | | | | | | | | | | | | | | J. David Chatham | | | | | 122,000 | | | | | 121,519 | | | | | 243,519 | | | | | | Douglas C. Curling | | | | | 95,000 | | | | | 121,519 | | | | | 216,519 | | | | | | John C. Dorman | | | | | 100,000 | | | | | 121,519 | | | | | 221,519 | | | | | | Paul F. Folino | | | | | 207,000 | | | | | 121,519 | | | | | 328,519 | | | | | | Thomas C. O'Brien | | | | | 104,500 | | | | | 121,519 | | | | | 226,019 | | | | | | Jaynie Miller Studenmund | | | | | 94,500 | | | | | 121,519 | | | | | 216,019 | | | | | | David F. Walker | | | | | 112,500 | | | | | 121,519 | | | | | 234,019 | | | | | | Mary Lee Widener | | | | | 82,500 | | | | | 121,519 | | | | | 204,019 | | | | | | | | | | | | | | | | | | | | | | | |
(1)The amounts shown reflect the aggregate grant date fair value of stock awards granted in 2016, computed in accordance with the Financial Accounting Standards Board's Accounting Standards Codification Topic 718, Compensation-Stock Compensation. We value the RSUs as of the grant date by multiplying the closing price of our common stock on that date by the number of RSUs awarded. The stock awards were granted to each non-management director on April 27, 2016.
(2)The aggregate numbers of RSUs held by each current non-management director as of December 31, 2016 were as follows:
| | | | | | | | | | | | | | | | Name | | Fees Earned or
Paid in Cash
($) | | Stock
Awards (1)(2) ($) | | Total ($) | J. David Chatham | | | | 125,000 | | | | | 159,978 | | | | | 284,978 | | Douglas C. Curling | | | | 96,500 | | | | | 159,978 | | | | | 256,478 | | John C. Dorman | | | | 112,500 | | | | | 159,978 | | | | | 272,478 | | Paul F. Folino | | | | 223,500 | | | | | 159,978 | | | | | 383,478 | | Claudia Fan Munce | | | | 104,079 | | | |
| 159,978
|
| | | | 264,057 | | Thomas C. O’Brien | | | | 113,500 | | | | | 159,978 | | | | | 273,478 | | Vikrant Raina | | | | 102,417 | | | |
| 159,978
|
| | | | 262,395 | | Jaynie Miller Studenmund | | | | 101,500 | | | | | 159,978 | | | | | 261,478 | | David F. Walker | | | | 125,000 | | | | | 159,978 | | | | | 284,978 | | Mary Lee Widener | | | | 95,000 | | | | | 159,978 | | | | | 254,978 | |
| (1) | The amounts shown reflect the aggregate grant date fair value of stock awards granted in 2018 computed in accordance with the Financial Accounting Standards Board’s Accounting Standards Codification Topic 718,Compensation-Stock Compensation. We value the RSUs as of the grant date by multiplying the closing price of our common stock on that date by the number of RSUs awarded. The stock awards were granted on May 1, 2018 to eachnon-management director. |
| (2) | The aggregate numbers of RSUs held by each currentnon-management director as of December 31, 2018 were as follows: |
| | | | | | | | | | | | | | | | | | | | | | | | Name | | Name
|
| | |
| Restricted Stock Unit
Awards (#)
|
| | | | | | | | | | | | | | | | | | J. David Chatham | | | | 3,190 | 3,760 | Douglas C. Curling | | | | 3,190 | | | | DouglasJohn C. Curling Dorman | | | | 3,190 | 3,760 | Paul F. Folino | | | | 3,190 | | | | John C. DormanClaudia Fan Munce | | | | 3,190 | 3,760 | Thomas C. O’Brien | | | | 3,190 | | | | Paul F. FolinoVikrant Raina | | | | 3,190 | 3,760 | Jaynie Miller Studenmund | | | | 3,190 | | | | Thomas C. O'BrienDavid F. Walker | | | | 3,190 | 3,760 | Mary Lee Widener | | | | | 3,190 | | Jaynie Miller Studenmund | | | | | 3,760 | | | | | | | David F. Walker | | | | | 3,760 | | | | | | | Mary Lee Widener | | | | | 3,760 | | | | | | | | | | | | | | | | |
The Compensation Committee reviews and recommends to the Board the form and level of director compensation. In March 2016, the Compensation Committee reviewed and recommended to the Board a new Directors' Compensation Policy that memorialized the current compensation paid by the Company to its non-management directors and included a deferral feature that permits non-management directors to elect to defer the receipt of their annual RSU awards until the earlier of termination of their Board service or a change in control of the Company. The Board approved and adopted the Directors' Compensation Policy in April 2016.
As described in the Compensation Discussion and Analysis, Pay Governance served as independent compensation consultant for the Compensation Committee for 20162018 and will continue to advise on the compensation of our directors for 2017.2019. During 2016,2018, as part of its engagement with the Committee, Pay Governance: •provided advice on the selection of a peer group of companies for director compensation comparison purposes;
Table of Contents
•- provided guidance on industry best practices and emerging trends and developments in director compensation;
•provided input on the design of the deferral program in the Directors' Compensation Policy;
•
reviewed director compensation;
•analyzed pay survey data; and
•provided advice on determining the structure and amounts payable under our director compensation program. The Compensation Committee reviews and recommends to the Board the form and level of director compensation. In December 2018, the Compensation Committee reviewed the Directors’ Compensation Policy and recommended no changes for 2019; the Board affirmed the recommendation of the Compensation Committee. The table below describes the components of thenon-management director compensation program in effect during 2016. No changes have been made to the non-management director compensation program for 2017. | | | | | | | | | | | | | | | | | | | | Compensation Element |
|
| 2016 |
| | | | | | | | | | | | | | Annual Retainer — Non-Management Director (1) | | $ | 70,000 | | | | | | Annual Equity Compensation — RSUs (2) | | $ | 135,000 | | | | | | Annual Retainer — Non-Management Board Chairman | | $ | 100,000 | | | | | | Annual Retainer — Committee Chairs (1) | | | | | | | | | Audit Committee | | $ | 25,000 | | | | | | Compensation Committee | | $ | 20,000 | | | | | | Nominating and Corporate Governance Committee | | $ | 15,000 | | | | | | Acquisition and Strategic Development Committee (3) | | $ | 12,500 | | | | | | Annual Retainer — Committee Members (1) | | | | | | | | | Audit Committee | | $ | 12,500 | | | | | | Compensation Committee | | $ | 10,000 | | | | | | Talent Development Committee (3) | | $ | 12,500 | | | | | | Nominating and Corporate Governance Committee | | $ | 7,500 | | | | | | Acquisition and Strategic Development Committee (3) | | $ | 5,000 | | | | | | Insurance Strategy Subcommittee (3) | | $ | 12,500 | | | | | | Fee for attendance of Board and Committee Meetings in Excess of Designated Number (4) | | $ | 2,000 | | | | | | | | | | | |
(1)Committee chair retainer represents amounts paid to each committee chair for their service in addition to the committee member annual retainer. Paid in cash in equal quarterly installments. Paid pro rata for directors joining the Board after the payment date.
(2)The award is granted and priced on the day of our annual meeting or, in the event of an out-of-cycle annual meeting such earlier date as may be approved by the Board, and vest on the first anniversary of the grant date. Vesting of the award will accelerate upon death, disability, retirement from the Board or a change in control.
(3)The insurance strategy subcommittee to the Acquisition and Strategic Planning Committee and the talent development subcommittee to the Compensation Committee were created in March 2015.
(4)Meeting fees paid only for meetings in excess of eight meetings of the Board, Audit and Compensation committees, and in excess of four meetings of the Nominating and Corporate Governance and Acquisition and Strategic Planning committees. Fees are paid in cash in connection with each such additional meeting.
Table of Contents2018:
| | | | | Compensation Element | | 2018 | | Annual Retainer —Non-ManagementDirector Share Ownership Guidelines(1) | | $ | 80,000 | | Annual Equity Compensation — RSUs(2) | | $ | 160,000 | | Annual Retainer —Non-Management Board Chairman | | $ | 100,000 | | Annual Retainer — Committee Chairs(1) | | | | | Audit Committee | | $ | 25,000 | | Compensation Committee | | $ | 20,000 | | Nominating and Corporate Governance Committee | | $ | 15,000 | | Strategic Planning and Acquisition Committee | | $ | 12,500 | | Annual Retainer — Committee Members(1) | | | | | Audit Committee | | $ | 15,000 | | Compensation Committee | | $ | 10,000 | | Nominating and Corporate Governance Committee | | $ | 7,500 | | Strategic Planning and Acquisition Committee | | $ | 5,000 | | Fee for attendance of Board and Committee Meetings in Excess of Designated Number (3) | | $ | 2,000 | |
| (1) | Committee chair retainer represents amounts paid to each committee chair for their service in addition to the committee member annual retainer. Fees are paid in cash in equal quarterly installments. Fees are paidpro-rata for directors joining the Board after the payment date. |
| (2) | The award is granted and priced on the day of our annual meeting or, in the event of anout-of-cycle annual meeting, such earlier date as may be approved by the Board, and vest on the first anniversary of the grant date (or the day prior to the date of the annual meeting if earlier). Vesting of the award will accelerate upon death, disability, retirement from the Board or a change in control. Directors joining the Board after the date of the Annual Meeting will receive a pro rata annual RSU award on the date the director joins the Board, which will vest on the same terms as the other annual RSU awards. |
| (3) | Meeting fees paid only for meetings in excess of eight meetings of the Board, Audit Committee and Compensation Committee, and in excess of four meetings of the Nominating and Corporate Governance Committee and Strategic Planning and Acquisition Committee. Fees are paid in cash in connection with each such additional meeting. |
Director Share Ownership Guidelines We require ournon-management directors to own a fixed amount of Company stock. The guidelines are based on a multiple of the annual retainer and, beginning in 2018, require a value of at least $350,000$400,000 be held by each director. Directors have five years from their date of election to the Board to reach the ownership requirement. All Company securities owned outright or earned and subject only totime-based vesting restrictions, countincluding deferred awards, are credited toward the requirement. Anti-Hedging and Pledging Policy Anti-Hedging and Pledging Policy
|
The Company maintains a policy that prohibits director transactions in put options, call options or other derivative securities on an exchange or in any other organized market, as well as holding Company securities in a margin account or otherwise pledging Company securities as collateral for a loan.
Table of Contents
EXECUTIVE OFFICERS Set forth below is information regarding our current executive officers. Our executive officers are appointed annually by the Board. | | | | | | |
| |
| |
| |
|
|---|
| | | | | | | | | Frank D. Martell |
| Age 59 |
|
|
President and Chief
Executive Officer (1) |
|
Biography is set forth under the heading Proposal 1 — Election of Directors
above. |
|
| James L. Balas Age 48 | | Age: 57 | Chief Financial Officer | | | | | | | | | | |
(1)Mr. Nallathambi, the Company's former President and Chief Executive Officer, was granted a temporary leave of absence on February 13, 2017 and passed away on March 2, 2017. Effective March 6, 2017, the Board appointed Mr. Martell to the position of President and Chief Executive Officer and principal executive officer.
| | | | | | |
| |
| |
| |
|
|---|
| | | | | | | | | James Balas |
| |
|
|
|
|
Business Experience |
|
|
|
|
|
|
CoreLogic, Inc. |
|
| | | | | -
has served as the Company’s Chief Financial Officer (2016-present)
-
Senior Vice President, Finance and Controller (2012-2016)
-
since April 2016. Mr. Balas joined CoreLogic in March 2011, as Senior Vice President, Controller (2011-2012)and principal accounting officer. In 2012, his role expanded to include oversight of finance in addition to his other responsibilities. Prior to joining the Company, Mr. Balas held a variety of senior finance leadership positions at severalpublicly-traded companies after a successful10-year career at Ernst & Young and Capgemini. Ameron International, a manufacturer of products and materials for the
chemical, industrial, energy, transportation and infrastructure markets
-
Vice President and Corporate Controller (2009-2011)
| | | Barry M. Sando Age 59 | | Chief Financial Officer | Managing Director, Underwriting and Workflow Solutions | | Mr. Sando has served as the Company’s Managing Director of Underwriting and Workflow Solutions (and predecessor business segments) since June 2010, when we became astand-alone public company. Mr. Sando has more than 30 years’ experience in the housing finance and property information business and previously served in various executive positions with our predecessor company, FAC. | Arnold A. Pinkston Age 60 | Chief Legal Officer and Corporate Secretary | | | | Age: 46 | | Various finance leadership roles:
-
Solar Integrated Technologies (2006-2009)
-
Keystone Automotive Industries (2003-2006)
-
Cap Gemini (2000-2003)
-
Ernst & Young (1993-2000)
| | |
|
|
|
|
BoardMr. Pinkston has served as the Company’s Chief Legal Officer and Council Service
Public Board Service |
|
|
|
|
|
|
Symbility Solutions Inc., a TSVX listed provider of insurance claims solutions for
Corporate Secretary since January 2018. In this role, he oversees the propertyglobal legal and health market verticals based in Toronto, Canada
(2014-present) |
|
| | | | | | | |
Table of Contents
| | | | | | |
| |
| |
| |
|
|---|
| | | | | | | | | Barry M. Sando |
| |
|
|
|
|
Business Experience
CoreLogic, Inc. |
|
| | | Senior Executive Vice
President, Group
Executive, Risk
Management and
Workflow | | -
Seniorcompliance teams. Previously, Mr. Pinkston served as Executive Vice President Group Executive, Risk Management and
Workflow (2014-present)
-
Group Executive and Executive Vice President, mortgage origination
services, default services and business and information services segments
(2010-2014)General Counsel for Allergan, Inc., amulti-specialty
| | |
|
|
Age: 57 |
|
The First American Corporation ("FAC"), our predecessor |
|
| | | | | -
President, information and outsourcing solutions business segment
(1997-2010)
-
Flood zone certification subsidiary
President (1997)
Executive Vice President (1995-1997)
-
Tax service subsidiary (1991-1995)
| | | | | | | | | |
| | | | | | |
| |
| |
| |
|
|---|
| | | | | | | | | Stergios Theologides |
| |
|
|
|
|
Business Experience
CoreLogic, Inc. |
|
| | | | | -
health care company, from 2011 to March 2015. From 2005 to 2011, Mr. Pinkston served as Senior Vice President, General Counsel and Secretary (2010-present) | | |
|
|
|
|
FAC |
|
| | | Senior Vice President,
General Counselfor Beckman Coulter, Inc., a health care diagnostics and
Secretary | | -
Senior life sciences company. From 1994 to 2005, he held various legal positions at Eli Lilly and Company, a global pharmaceutical company, including Vice President and Deputy General Counsel, Information Solutions Group
(2009-2010)
Counsel.
Morgan Stanley
-
Executive Vice President and General Counsel, U.S. Residential Mortgage
businesses, overseeing legal, compliance, operational risk, fraud prevention,
quality assurance and consumer and community affairs for Morgan Stanley's
mortgage origination and servicing platforms (2007-2009)
| | | | | Age: 50 | | | | | | | | | New Century Financial Corporation | | | | | | | -
Executive Vice President and General Counsel, overseeing legal, compliance,
privacy, security, consumer relations and government affairs (1998-2007).
New Century filed for bankruptcy protection in 2007 and was ultimately
liquidated
| | |
|
|
|
|
O'Melveny & Myers LLP |
|
| | | | | -
Corporate and securities practice (1992-1996)
| | |
|
|
|
|
Board and Council Service
Prior Council and Industry Association Service |
|
|
|
|
|
|
Federal Reserve Board's Consumer Advisory Council |
|
| | | | | | | |
Table of Contents
COMPENSATION DISCUSSION & ANALYSIS COMPENSATION DISCUSSION & ANALYSIS |
This Compensation Discussion and Analysis (CD&A)(“CD&A”) describes our compensation program, including our compensation strategy, philosophy, polices, programs and practices (our compensation program) for our named executive officers (NEOs)NEOs and the positions they held in 2016.2018. For purposes of this CD&A, the Committee refers to the Compensation Committee of our Board of Directors. | | | | | | | | |
| |
| |
| |
| |
|
|---|
| | | | | | | | | Named Executive Officer | | Named Executive Officer | | | | Position as of December 31, 2016(1) | | 2018 | | | | | | | | | | | | Anand Nallathambi | | Frank D. Martell | | President and Chief Executive Officer | | | | | | | | | | | | | | Frank D. Martell | | | | Chief Operating Officer | | | | | | | | | | | | | | James L. Balas | | | | Chief Financial Officer | | | | | | | | | | | | Barry M. Sando | | Barry M. SandoManaging Director, Underwriting and Workflow Solutions | Arnold A. Pinkston | | | | Senior Executive Vice President, Group Executive, Risk ManagementChief Legal Officer and Workflow | | | | | | | | | | | | | | Stergios Theologides | | | | Senior Vice President, General Counsel andCorporate Secretary | | | | | | | | | | | |
(1)Mr. Balas was promoted to Chief Financial Officer on April 8, 2016. Mr. Nallathambi was granted a temporary leave of absence on February 13, 2017 and passed away on March 2, 2017. Mr. Martell was appointed President and Chief Executive Officer effective March 6, 2017.
2018 BUSINESS HIGHLIGHTS Selected 2016 Business Highlights
|
Our compensation program is designed to align the interestinterests of our executive officers with those of our stockholders through execution in three areas of strategic focus:growth and scale,innovation, operational excellence, and high performing organization. A significantorganization. In 2018, a majority of our NEOs'NEOs’ compensation is dependentcontinued to be based upon our financial performance and execution ofagainst these strategic priorities. Our 2016 As we set our 2018 performance goals early in the year, we anticipated the potential for a high degree of volatility and unpredictability based on expectations for the economic environment such as: An increasing interest rate environment due to a strong US economy. A decline in overall US mortgage origination unit volumes by approximately 10% compared to 2017 levels as the onset of rising interest rates would unfavorably impact mortgage refinance activity. Continuing impact on mortgage origination purchase volumes due to multiple factors such as tight inventory supply, insufficient supply of new housing stock, and affordability, all of which we expect to continue for the foreseeable future. We delivered strong operating and financial success is the direct result of our ability to provide clients with data-driven solutions to improve underwriting decisions, manage risks, and capitalize on developing business opportunities. | | | | | | | | | | | | Since 2011, we grew revenues at an annual
compounded rate of 12%, adjusted EBITDA by
15%, and adjusted EPS by 31%
|
| | | | | | |
We achieved strong results in 2016. Highlights2018 despite significant US mortgage market headwinds. In the face of these headwinds, we reduced our 2016 operating resultsoverall cost structure by more than $20 million through productivity initiatives and cost management, continued to invest in future growth and productivity initiatives, and completed targeted acquisitions to enhance our business mix by increasing ournon-mortgage and international footprints while driving higher technology platform revenues. We invested in next generation technology capabilities focusing on data structures and visualization, technology platforms, and advanced automation techniques, which we expect will set a foundation for future growth and margin expansion. Finally, we enhanced our infrastructure capabilities as we initiated our migration to the Google Cloud platform.
Notable financial accomplishments in 2018 include: Significant market outperformance as our 2018 revenues were down 3%, as compared to 2015 include the following:with a 15% estimated drop in overall US mortgage market unit volumes. 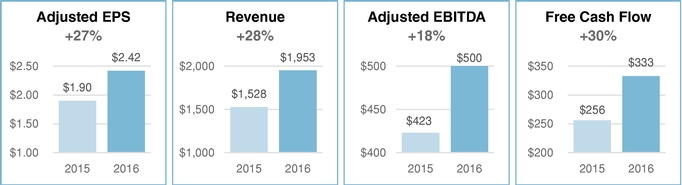
Table of Contents
Please see Appendix A for a detailed reconciliation ofIncreased adjusted EBITDA by 3% and adjusted EPS by 15%, supported by our productivity and cost initiatives.
Generated $258 million of free cash flow (FCF)while reinvesting to the most directly comparable GAAP financial measures.drive future growth and margin expansion. Delivered more than $20 million in cost management and productivity benefits. Repurchased approximately 3% of our outstanding common shares. We also invested for our long-term growthattribute these results to management’s ability to navigate market volatility and maintain focus in 2016 while returning substantial capital to stockholders in the forma time of share repurchases of approximately 6% of total shares outstanding.significant change, with strong leadership from Mr. Martell. | | | | | | | | | | | | We returned $195 million to stockholders and
reduced our outstanding share count by
5 million shares, or 6%
|
| | | | | | |
We accomplished key operational improvements in 2016. In addition to our solid financial results,EXECUTIVE COMPENSATION HIGHLIGHTS
Since 2011, we successfully achieved a number of key operational goals in 2016 that will enable future success, including: ➢We exceeded our cost reduction target through a reduction in organizational complexity, refining and automating work processes, and shrinking our real estate footprint, all of which contributed to expanded operating margins.
➢We drove strong organic growth in our Risk Management and Workflow (RMW) segment, primarily through share gains, price increases and growth in new product sales.
➢We grew revenue significantly in the Property Intelligence (PI) segment, primarily through the launch of the Valuation Solutions Group (VSG).
➢We achieved a company-wide organic growthhave grown revenues at an annual compounded rate of 5%7%, operating margin by 821 bps and adjusted EPS by 24%.
➢We simplified our capital structure, which provided both additionalaligned annual incentives to rigorous financial flexibilitytargets. The Company’s underlyingpay-for-performance approach is intended to reward management appropriately in light of below- and above-expected performance results through use of a significant reduction in borrowing costs.
Executive Summary of 2016 Compensation
|
Our compensation program rewarded strong financial results. Our 2016 financialweighted combination of three performance metrics. For 2018, the Company exceeded targetsits adjusted EBITDA target by 2.7%, but fell below target for revenue(-4.6%) and resulted in above-target payouts. ResultsFCF(-2.4%). Combined results for revenue, adjusted EBITDA and free cash flowFCF generated funding of the ICP (ourfor corporate participants in our annual cash bonus plan) at 146% of target.
Notwithstanding these strong results, management and the Committee reduced bonus payouts by 5%. Despite our strong financial results and above-target payout, management recommended and the Committee approved a reduction in ICP funding by 5% across the enterprise because acquisition-related assumptions used in setting target performance did not meet timing expectations. This reduced the calculated bonus to 139% of target. In addition, the payout for the strategic goals portion ofplan, the ICP, relative to the funded amount, was increased for one NEO, reduced for one NEO,of 96.7% of target.
We assessed and unchanged for three NEOs. Finally, results for adjusted EPS and our three-year total stockholder return (TSR) relative to our peer group generated a payout of 124.5% in our long-term performance share plan for 2014-2016. No across the board increase in base salaries for 4thconsecutive year. Notwithstanding strong operating results, consistent with our practices in recent years, the Committee did not increase NEO base salaries for 2016, except for Mr. Balas in consideration of his promotion to Chief Financial Officer.
Table of Contents
Our compensation program also rewarded our manymost significant strategic accomplishments. The chart below highlightsOur decisions on ICP awards took into consideration a number of key accomplishments in 20162018 across our three strategic focus areas:areas as noted below. Based on overall strong strategic accomplishments in the face of a challenging revenue environment, and individual contributions to those accomplishments, the Committee awarded our four NEOs from 110% to 131% of target. Total resulting payouts for our NEOs ranged from 95% to 100% of the overall ICP target for 2018.
| | | | | | | | |
| |
| |
| |
| |
|
|---|
| | | | | | | | | | | Strategic Focus | | | | 2016 Accomplishments |
| | | | | | | | | | | | | Grow and
Scale | | | | ü
Grew revenue 28%, driven by double digit growth in the PI segment and strong organic growth in the RMW segment
ü
Strengthened new product pipeline with high potential products and made significant progress on generating sales from newer product launches demonstrated by our solid organic growth rate in the second half of 2016
ü
Launched the VSG and outlined strategic plan and solutions roadmap, achieving all integration milestones
| | | | | | | | | | | | | | Operational
Excellence | | | | ü
Exceeded our $30 million cost reduction target by consolidating facitlities, reducing staff costs, outsourcing certain business activites, and delivering on other operational improvements
ü
Advanced innovation and technology transformation through expansion of CoreLogic Labs
ü
Completed refinancing and bond redemption, resulting in significantly lower borrowing costs and greater financial flexibility
| | | | | | | | | | | | | | High Performing
Organization | | | | ü
Launched core Centers of Expertise to elevate focus on client service, quality and delivery
ü
Established landmark state-of-the-art hub facility in Dallas, Texas, bringing together representatives across all operating units to drive innovation, collaboration and service excellence
ü
Simplified our organization model, making it easier to do business with CoreLogic
| | | | | | | | | | | |
2016 Say on Pay Vote and Engagement with Our Stockholders
|
| | | | | | | | | | Strategic Focus | | 97% stockholder support on our 2016 say on pay
2018 Accomplishments |
Growth and Innovation | | ✓ Core mortgage businessesout-performed US mortgage market volume trends ✓ Expanded deployment of solutions bundling intended to secure significant market share gains ✓ Completed several acquisitions to expand and scale our platform, international, and insurance capabilities footprint | Operational Excellence | | ✓ Exceeded productivity savings targets ✓ Invested in data technology enhancements, artificial intelligence, and visualization to enhance future growth and offering capabilities ✓ Launched migration to Google Cloud to further technology infrastructure capabilities and efficiencies ✓ Enhanced the vendor supply chain to improve quality, security, and IP protection ✓ Generated strong free cash flow, which was modestly below target, despite enhanced investment levels to support future growth and productivity | High Performing Organization | | ✓ Developed employee engagement action plans based on a global employee satisfaction survey (93% employee participation) ✓ Expanded the talent review process to emphasize the development of high-potential talent ✓ Continued transformation of shared services functions to enhance quality and reduce cost, and invested in automation and systems related to finance and human capital ✓ Initiated a focused, long-term incentive program for our top 40 business leaders (excluding the CEO) to accelerate growth and margins |
We have had strong support from stockholdersStrong Stockholder Support on Say on Pay.Pay
Our Board and management are committed to maintaining sound and effective compensation and governance policies and programs designed to build value for our stockholders. At our 20162018 Annual Meeting, 97%98% of the votes cast were in favor of the advisory vote to approve our executive compensation.compensation paid in 2017. With this support in favor of our existing compensation program, absence of negative feedback from our stockholder outreach effort, and following its regular review of our practices, the Committee determined to maintaincontinue our 20162017 compensation program for 2017.in 2018 with only minor adjustments. We engage
Active Engagement with Our Stockholders The Board and executive management are committed to engaging with our major stockholders. Throughout the year, executive management proactively and consistently meets with current and prospective stockholders to discuss our strategic priorities, operational performance, and financial results. Also, through these discussions or separate outreach efforts, we seek to engage our top stockholders to solicit feedback on corporate governance, our compensation program, and related matters. In early 2017, as part of our stockholder engagement strategy,2018, we conducted such outreach to 20 of our top stockholders representing approximately 60% ownership. Our stockholder outreach includes ongoing discussions with manya majority of our investors and we often solicit their feedback on a variety of topics, including executive compensation. Theoutstanding shares; these stockholders we reached out to did not express concerns over our corporate governance practices or compensation program design or practices. In addition to soliciting feedback fromdesign. We did not make across-the-board increases in base salaries for the 6th consecutive year.Notwithstanding strong results, consistent with our stockholders,practices in recent years, the Committee routinely assesses our compensation programsdid not increase NEO base salaries for market trends. The Committee adjusted Mr. Martell’s salary in recognition of his strong leadership and seeks to
Table of Contents
maximize alignment between stockholder return and executive compensation while incentivizing and retaining a high-performing management team.
We pay for performance. Our compensation program is heavily weighted toward performance-based compensation that provides a direct link between rigorous goals for corporate performance and pay outcomes for our executive officers. Our annual incentive plan also ties pay outcomes to the achievement of key strategic objectives that we believe will drive longer-term value to stockholders. We believe that our compensation program provides effective incentives for strong operating results by appropriately aligning pay and performance. Our philosophy is designed to:
➢Attract, motivate and retain highly-qualified executive officers critical to our long-term success;
➢Align the interests of our executive officers with the interests of our stockholders;
➢Reward executive officers for achieving pre-defined stretch financial goals and strategic objectives that may not yield current-period financial results but are expected to position us for enhanced results in future periods;
➢Encourage strategic long-term development and profitable investment in the business;
➢Motivate and reward appropriate but not excessive risk-taking to grow the business; and
➢Support pay practices with strong corporate governance and independent board oversight.
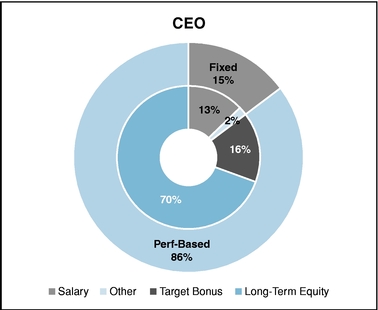
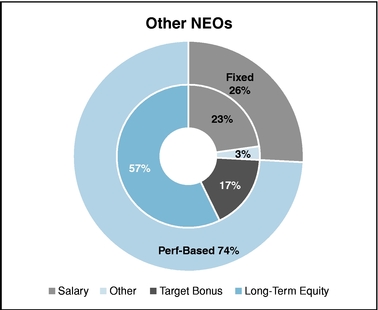
Performance-Based Compensation Mix
|
We have four elements of total compensation:
1Base salary
2Annual cash incentive compensation plan (ICP) award
3Long-term equity incentives
4Other compensation (benefits and perquisites).
86% of our CEO compensation and 74% of the compensationbusiness through a challenging US mortgage market environment. The Committee also adjusted the salary for the other NEOs is performance-based.Mr. Balas in recognition of his continued strong leadership in his CFO role. The chart below demonstrates our pay mix.
Tablenew salaries for Mr. Martell and Mr. Balas move each of Contents
Performance-Vested Equity Awards. In 2016, 50% of the target value of our long-term incentive awards for our CEO and other NEOs was granted in the form of performance-based restricted stock units ("PBRSUs") that vest based on adjusted EPS results relativethem to target and TSR relative to the companies in our peer group (see description of the peer group later in this section). The remaining 50% of target value was granted in the form of time-vested restricted stock units ("RSUs") that require us to achieve a threshold adjusted net income level in order to be eligible to vest.
Use of Rigorous Goals in Our Incentive Plans. We set challenging goals for both our annual incentive and long-term equity plans. The chart below demonstrates the variance in payouts since 2014, outcomes that reflect our pay for performance approach to compensation. Because acquisition-related assumptions used in setting target performance did not meet timing expectations, management recommended and the Committee approved a 5% decrease in the 2016 ICP pool on an enterprise basis. This reduced the overall calculated bonus from 146% to 139% of target.
NEO ICP Corporate Financial Funding as a
% of Target
3 Year Overview
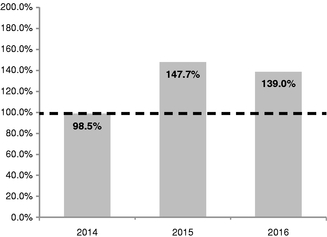
| | | | | | | | | | | | | | | | | | | | | | | | | | | | | | | | | | | | | | | | | Performance vs. Budget (% of Target) | | | | | | | | | | | | | | | | | | | | | | | | | | | | 2014 | | | | 2015 | | | | 2016 | | | | | | | | | | | | | | | | | | | | | | | | Revenue | | | | 99% | | | | 102% | | | | 106% | | | | | | | | | | | | | | | | | | | | | | | | Adjusted EBITDA | | | | 87% | | | | 107% | | | | 102% | | | | | | | | | | | | | | | | | | | | | | | | Free Cash Flow | | | | 134% | | | | 144% | | | | 132% | | | | | | | | | | | | | | | | | | | | |
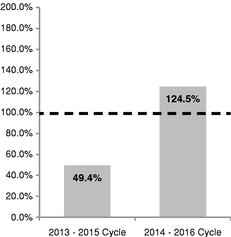
Long-term Incentives. Payouts under our PBRSU awards also illustrate our use of rigorous performance targets and our adherence to pay for performance. Because we had a sub-optimal result on adjusted EPS in 2014, the 2013 PBRSU award (with a 2013-2015 performance period) paid out at less than half of target value. In contrast, the 2014 PBRSU award (with a 2014-2016 performance period) paid out at 124.5% of target based on particularly strong results in 2015 and 2016.
Table of Contents
Average NEO PBRSU Payout as a %
of Target
2 Performance Cycle
(4-Year) Overview
No Base Salary Increases Each Year. Our practice is to benchmark compensation annually but to increase an NEO's base salary only when warranted by an increase in the scope of responsibilities or significant gaps tomore competitive pay levels. Only Mr. Balas received a base salary increase in 2016 in consideration of his appointment to Chief Financial Officer. In light of anticipated mortgage market headwinds in 2017, the Committee decided that all NEOs will forego base salary increases for 2017, except for Mr. Martell whose salary was increased in connection with his promotion to President and Chief Executive Officer in March 2017.
Use of Strategic Goals in Our ICP. The achievement of strategic goals represents 25% of the annual ICP opportunity for our executive officers. We believe this approach rewards the accomplishment of key objectives that will drive future performance. The strategic goals portion is funded by the results on financial goals. The Committee separately determines the portion of the funded amount that should be paid as a result of achievement of the individual objectives. The Committee carefully evaluates management's accomplishments relative to the goals, as further described below.GOOD PAY GOVERNANCE PRACTICES
Our CEO pay is aligned to stock price performance. The alignment of CEO total direct compensation (base salary, ICP and LTI) and our TSR over the past three years, depicted in the table below, demonstrates alignment of CEO actual pay with results for stockholders. These pay amounts do not include change in pension value or "All Other Compensation" in the 2016 Summary Compensation Table below.
Table of Contents
CEO Compensation-TSR Alignment
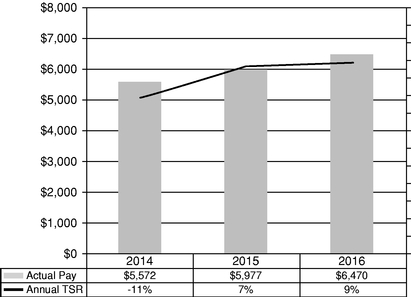
Table of Contents
Pay Program Design and Practices
|
We employ good governance practices.The Committee oversees the design and administration of our compensation program and evaluates it against competitive practices, legal and regulatory developments and corporate governance trends. The Committee has incorporated the following leading governance features into our compensation program:
| | ✓ | ✓
Review total compensation relative to the median of a peer group ofindustry-aligned companies with similar executive talent needs |
| ✓ | ✓
Tie annual incentives to achievement of multiple stretchrigorous financial and operating goals |
| ✓ | Useperformance-based ✓
Use performance-based vesting for 50% oflong-term compensation, tied to achievement of stretch EPS targets and total stockholder return (TSR)TSR relative to our peers
|
| ✓ | Cap performance-based vesting of performance shares at 150% of target if3-year TSR ranks below 55th percentile |
| ✓ | Require achievement of threshold adjusted net income level to be eligible to vest in RSU awards |
| ✓ | Maintain robust stock ownership guidelines and require covered executives to retain 50% of netafter-tax shares earned until the guidelines are met |
| ✓ | ✓
Maintain a clawbackclaw-back policy for incentive payments |
| ✓ | ✓
Use an independent compensation consultant retained directly by the Committee, in its sole discretion, who performs no consulting or other services for the Company's management |
| ✓ | ✓
Require double-trigger for accelerated vesting upon termination of employment following a change in control |
| ✓ | ✓
Assess annually potential risks relating to the Company'sCompany’s compensation policies and practices | | |
| | | | | | | | | | | | | | | | | | | | | | | | | | | What We Don’t Do |
| × | | What We
Don't Do
|
| | | ✗
Incentivize participants to take excessive risks |
| × | ✗
Award discretionary bonuses to our executive officers outside of our ICP |
| × | ✗
Allow margining, derivative, or speculative transactions, such as hedges, pledges, and margin accounts, by executive officers |
| × | ✗
Provide excessive perquisites |
| × | ✗
Provide excise taxgross-ups upon termination with a change in control or taxgross-upsfor other awardscompensation |
| × | ✗
Allow for repricing of stock options without stockholder approval |
| × | ✗
Pay "single-trigger" “single-trigger”change-of-control cash payments or have "single-trigger"“single-trigger” equity accelerationvesting |
PAY PHILOSOPHY We pay for performance.Our compensation program is heavily weighted towardperformance-based compensation that provides a direct link between rigorous goals for corporate performance and pay outcomes for our executive officers. Our annual ICP also ties pay outcomes to the achievement of key strategic objectives that we believe will drivelonger-term value to stockholders. We believe that our compensation program provides effective incentives for strong operating results by appropriately aligning pay and performance. Our philosophy is designed to: | | | Compensation Philosophy | | • Attract, motivate and retainhighly-qualified executive officers critical to ourlong-term success • Align the interests of our executive officers with the interests of our stockholders • Reward executive officers for achievingpre-defined rigorous financial goals and strategic objectives that may not yieldcurrent-period financial results but are expected to position us for enhanced results in future periods • Encourage strategiclong-term development and profitable investment in the business • Motivate and reward appropriaterisk-taking to grow the business • Support pay practices with strong corporate governance and independent board oversight | | | | | | | | | |
Table of Contents
2016 Compensation Program OverviewPrimary Elements
| | 1 Base salary 2 Annual cash incentive compensation plan award 3 Long-term equity incentives 4 Other compensation (welfare, retirement, termination and other benefits) |
Our compensation program emphasizes performance-based incentives.86% of our CEO compensation and 75% of the compensation for the other NEOs isperformance-based. The chart below illustrates our pay mix. 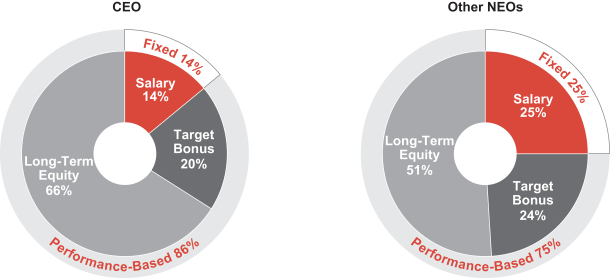
We increase base salaries based on performance or promotion.Our practice is to benchmark compensation annually but to increase an NEO’s base salary only when warranted by sustained performance, an increase in the scope of responsibilities or significant gaps to competitive pay levels. Only Messrs. Martell and Balas received base salary increases in 2018 to recognize performance and move their respective salaries to more competitive levels. We set rigorous goals in our incentive plans. We set challenging goals for both our annual incentive and long-term equity plan. We outperformed US mortgage market trends and delivered single-digit top line growth in our core operations, resulting in the achievement of our adjusted EBITDA target and near-achievement of our revenue and FCF targets. We use strategic goals in our ICP.Results on strategic goals represent 25% of the annual ICP opportunity for our executive officers. We believe this approach rewards the accomplishment of key objectives that will drive future performance. The Committee separately determines the portion of the funded amount that should be paid as a result of achievement of the assigned objectives. The Committee carefully evaluates management’s accomplishments relative to the goals, as further described below. We focus on long-term stockholder value.Nearly 70% of the total compensation opportunity for our CEO is based on achievement ofstockholder-aligned performance and the value of our shares. For other NEOs, over half of their total target compensation opportunities are tied to these stockholder results. Our equity grants are tied to performance.In 2018, 50% of the target value of ourlong-term incentive awards for our CEO and other NEOs was granted in the form ofperformance-based restricted stock units (“PBRSUs”) that vest based on achievement of adjusted EPS results relative to target and TSR relative to the companies in our Peer Group (as described and defined later in this section). The remaining 50% of the target value of our long-term incentive awards was granted in the form of RSUs that require us to achieve a threshold adjusted net income level in order to be eligible to vest. We set rigorous goals in our PBRSU awards, as reflected in the variability of payouts in the last three awards. The payouts above target reflect improved performance. In addition, to further incentivize the expansion of adjusted EBITDA margin between 2018 and 2020, we granted certain key executives, including our NEOs but excluding our CEO, an additional performance-based long-term incentive award in 2018 (see the description of the A30 Award below). 3-Year PBRSU Payouts 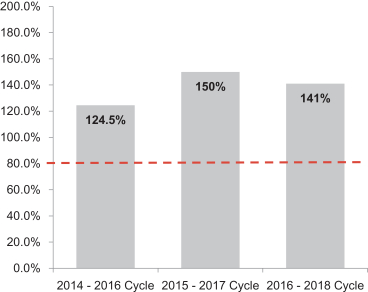
2018 COMPENSATION PROGRAM OVERVIEW The following table describes our pay program including the role and purpose for each aspect of it. | | | | | | | | | | | | | | | | | | | | | | | | | | | | | | ELEMENT | | DESCRIPTION | | ROLE AND PURPOSE |
| | | | | | | DESCRIPTION | | | | | ROLE AND PURPOSE | | | | | | | | | | | | REWARDS STRATEGY | | | | | | Review target total pay relative to market median and determine individual pay based on experience and performance
Tie approximately 75% or more of target pay opportunity to operating results and share price performance | | | | ProvideProvide market-competitive mix of base salary, cash incentives and equity incentives Aligns
Align compensation to results for our stockholders | | | | | | BASE SALARY | |
|
|
| | Competitive fixed compensation Base salary increased primarily for promotions or adjusted for competitive pay levels | | | | | | | | | | | | | BASE SALARY | | Competitive fixed compensation
Limited increases since 2011
No base salary increase for CEO since 2011
| | ProvidesProvide competitive level of fixed pay to attract, motivate and retainhighly-qualified executives Increases generally provided only
Limited salary increases control fixed costs and emphasize pay for role expansionperformance | | | | | | ANNUAL INCENTIVE PROGRAM (ICP) | | | | | | Base incentives on performance against rigorous targets for revenue, adjusted EBITDA, FCF and strategic goals | | | | Motivate and reward achievement of key financial goals and strategic accomplishments that drive stockholder value | | | | | | LONG-TERM EQUITY INCENTIVES | | | | | | Performance- Based Restricted Stock Units (PBRSUs) | | | | | | | | | ANNUAL INCENTIVE
PROGRAM (ICP) | | Annual cash incentives based on performance against established targets for revenue, adjusted EBITDA, cash-flow and strategic goals | | Motivates and rewards executives for achievement of key financial results and strategic accomplishments that drive stockholder value | | | | | | | | | | | | | | | | LONG-TERM | | Performance-
Based Restricted
Stock Units
(PBRSUs) | | 50% of 20162018 total LTI grant value for executive officers Shares earned based on 3 years of adjusted EPS performance, modified by TSR relative to our peers | | Focuses | | Focus and rewards executives onreward for achievement of operating results over the long term
Use of operating results and relative TSR ensures alignment of payouts with our performance relative to the broader market EPS growth historically has been highly aligned with our share price | | | | | | | | | | | | INCENTIVESRestricted Stock Units (RSUs) | | | | | | | | | | | | | | | Restricted Stock
Units (RSUs) | | 50% of 20162018 total LTI grant value for executive officersGrants vest ratably over three years
Requires achievement of threshold operatingadjusted net income goal to be eligible for vesting | | Enhances | | Enhance retention of key talent Value at vesting based on stockshare price, which aligns executives with stockholdersstockholders’ interests | | | | | | | | | | | | | | | | | | RETIREMENT PROGRAMS | | | | | | | | | | | | | | | | | RETIREMENT PROGRAMS | | 401(k) program for all employees
Legacy supplemental executive retirement plan frozen in 2010 with no new entrants allowed Limited benefits available | | | | ProvideAligns with market-prevalent retirement programs Focuses
Focus executives on accumulating savings | | | | | | | | | | | | | | | | PERQUISITES | | Limited benefits available | | FocusesFocus executives on rewards fromvalue-creating activities | | | | | | | | | | | | PERQUISITES | | | | | | | | | | |
Table of Contents
Determining Pay Generally, in determining base salary, target annual ICP and guidelines forlong-term equity awards, the Committee considers a number ofseveral factors including, but not limited to, the executive officer's:officer’s: ➢role, including the scope and complexity of responsibilities;
➢experience and capabilities, including institituionalinstitutional knowledge;
➢contributions or responsibilities beyond the typical scope of the role;
➢individual performance;
➢comparisons withpositioning relative to our other executive officers;
➢difficulty in recruiting a replacement; and
➢competitive compensation opportunities provided by our peers and other competitors for similar execuitiveexecutive talent.
Consideration of Prior Amounts Realized
|
Our philosophy is to incentivize and reward executive officers for future performance. While the Committee regularly reviews executive officer equity grants and vesting, it does not consider prior stock compensation gains (option gains(PBRSU payouts or restricted stock awarded in prior years) in setting future compensation levels. Peer Group and Benchmarking Peer Group and Benchmarking
|
In order toTo monitor competitive compensation practices, the Committee relies primarily upon data compiled from public filings of selected companies (our peer group)“Peer Group”) that it considers to be competitors or appropriate comparators for executive talent. The Committee reviews and approves the Peer Group annually. Criteria for peer groupPeer Group selection include firms that operate in data, information and analytics and related businesses. Our 2016 peer group2018 Peer Group is presented in the table below.
| | | | | | | | | | | | | | | | | | | | | | CORELOGIC 2018 PEER GROUP | | | | | | | | | | | | | | | | | | Comparator Group Rationale | | | | | | | | | Company | | Revenue | | | Market
Value | | | EBITDA Margin | | | Comparable
Revenue Size | | Comparable
Market Value | | Data Analytics | | Direct
Talent
Competitor | | | | | | | | | | | | ($MM) | | | ($MM) | | | (%) | | | | | | | | | | Fidelity National Financial, Inc. | | $ | 7,875 | | | $ | 8,653 | | | | 14 | % | | | | | | ✓ | | | First American Financial Corporation | | $ | 5,812 | | | $ | 4,990 | | | | 14 | % | | | | ✓ | | ✓ | | ✓ | Broadridge Financial Solutions, Inc. | | $ | 4,330 | | | $ | 11,237 | | | | 19 | % | | | | | | | | ✓ | Gartner, Inc. | | $ | 3,901 | | | $ | 11,620 | | | | 15 | % | | ✓ | | | | ✓ | | ✓ | Global Payments Inc. | | $ | 3,540 | | | $ | 16,316 | | | | 36 | % | | ✓ | | | | | | | Equifax Inc. | | $ | 3,415 | | | $ | 11,229 | | | | 25 | % | | ✓ | | | | | | ✓ | Paychex, Inc. | | $ | 3,381 | | | $ | 23,395 | | | | 42 | % | | ✓ | | | | | | | Euronet Worldwide, Inc. | | $ | 2,492 | | | $ | 5,279 | | | | 19 | % | | ✓ | | ✓ | | | | | FleetCor Technologies, Inc. | | $ | 2,400 | | | $ | 16,464 | | | | 54 | % | | ✓ | | | | | | | Verisk Analytics, Inc. | | $ | 2,352 | | | $ | 17,950 | | | | 45 | % | | ✓ | | | | ✓ | | ✓ | Teradata Corporation | | $ | 2,202 | | | $ | 4,534 | | | | 7 | % | | ✓ | | ✓ | | ✓ | | ✓ | Jack Henry & Associates, Inc. | | $ | 1,537 | | | $ | 9,780 | | | | 31 | % | | ✓ | | | | | | ✓ | Black Knight, Inc. | | $ | 1,096 | | | $ | 6,732 | | | | 34 | % | | ✓ | | ✓ | | ✓ | | ✓ | Fair Isaac Corporation | | $ | 1,032 | | | $ | 5,415 | | | | 23 | % | | ✓ | | ✓ | | ✓ | | ✓ | CSG Systems International, Inc. | | $ | 833 | | | $ | 1,059 | | | | 19 | % | | ✓ | | ✓ | | | | | 75th Percentile | | $ | 3,901 | | | $ | 16,316 | | | | 36 | % | | — | | — | | — | | — | 50th Percentile | | $ | 2,492 | | | $ | 9,780 | | | | 23 | % | | — | | — | | — | | — | 25th Percentile | | $ | 1,537 | | | $ | 5,279 | | | | 15 | % | | — | | — | | — | | — | CoreLogic, Inc. | | $ | 1,839 | | | $ | 2,692 | | | | 23 | % | | — | | — | | — | | — | Notes: Data above reflects most recent fiscal year (2018) results when available; if FY18 financial results not yet released at the time of this report, revenue and EBITDA data reflect12-month trailing results for Q4 of 2017 and Q1 - Q3 of 2018. |
Table of Contents
| | | | | | | | | | | | | | | | | | | | | | | | | | | | | | | | | | | | | | | | | | | | | | | CoreLogic 2016 Peer Group |
| | | | | | | | | | | | | | | Comparator Group Rationale |
| | | | Company | | | Revenue | | | Market Value | | | EBITDA Margin | | Comparable
Revenue Size |
| Comparable
Market Value |
| Data
Analytics |
| Direct Talent
Competitor |
| | | | | |
| ($MM)
|
|
| ($MM)
|
|
| (%) |
| | | | | | | | | | | | | | | | | | | | | | | | | | | | | | | | | | | Fidelity National Financial | | $ | 9,554 | | $ | 9,622 | | | 17 | % | | | | | ✔ | | | | | | | | | | | | | | | | | | | | | | | | | | | | | | First American Financial | | $ | 5,576 | | $ | 3,904 | | | 11 | % | | | ✔ | | ✔ | | ✔ | | | | | | | | | | | | | | | | | | | | | | | | | | | | Equifax | | $ | 3,145 | | $ | 14,159 | | | 36 | % | ✔ | | | | | | ✔ | | | | | | | | | | | | | | | | | | | | | | | | | | | | Broadridge Financial Solutions | | $ | 2,897 | | $ | 7,708 | | | 20 | % | ✔ | | | | | | ✔ | | | | | | | | | | | | | | | | | | | | | | | | | | | | Gartner | | $ | 2,445 | | $ | 7,515 | | | 17 | % | ✔ | | | | ✔ | | ✔ | | | | | | | | | | | | | | | | | | | | | | | | | | | | Verisk Analytics | | $ | 1,995 | | $ | 13,592 | | | 50 | % | ✔ | | | | ✔ | | ✔ | | | | | | | | | | | | | | | | | | | | | | | | | | | | Dun & Bradstreet | | $ | 1,704 | | $ | 4,463 | | | 29 | % | ✔ | | | | ✔ | | ✔ | | | | | | | | | | | | | | | | | | | | | | | | | | | | DST Systems | | $ | 1,557 | | $ | 3,504 | | | 23 | % | ✔ | | ✔ | | | | ✔ | | | | | | | | | | | | | | | | | | | | | | | | | | | | Henry (Jack) & Associates | | $ | 1,355 | | $ | 6,884 | | | 35 | % | ✔ | | | | | | ✔ | | | | | | | | | | | | | | | | | | | | | | | | | | | | Neustar | | $ | 1,210 | | $ | 1,829 | | | 41 | % | ✔ | | ✔ | | ✔ | | | | | | | | | | | | | | | | | | | | | | | | | | | | | | Black Knight Financial Services | | $ | 1,026 | | $ | 2,612 | | | 43 | % | ✔ | | ✔ | | ✔ | | ✔ | | | | | | | | | | | | | | | | | | | | | | | | | | | | Fair Isaac | | $ | 881 | | $ | 3,844 | | | 23 | % | ✔ | | ✔ | | ✔ | | ✔ | | | | | | | | | | | | | | | | | | | | | | | �� | | | | | ACXIOM(1) | | $ | 880 | | $ | 1,666 | | | 14 | % | ✔ | | ✔ | | ✔ | | ✔ | | | | | | | | | | | | | | | | | | | | | | | | | | | | CSG Systems | | $ | 761 | | $ | 1,562 | | | 23 | % | ✔ | | | | | | | | | | | | | | | | | | | | | | | | | | | | | | | | | | Ciber(1) | | $ | 680 | | $ | 279 | | | -5 | % | ✔ | | | | | | | | | | | | | | | | | | | | | | | | | | | | | | | | | | IHS(2) | | | — | | | — | | | — | | — | | — | | ✔ | | | | | | | | | | | | | | | | | | | | | | | | | | | | | | 75th Percentile | | $ | 2,671 | | $ | 7,611 | | | 35 | % | — | | — | | — | | — | | | | | | | | | | | | | | | | | | | | | | | | | | | | 50th Percentile | | $ | 1,557 | | $ | 3,904 | | | 23 | % | — | | — | | — | | — | | | | | | | | | | | | | | | | | | | | | | | | | | | | 25th Percentile | | $ | 954 | | $ | 2,220 | | | 17 | % | — | | — | | — | | — | | | | | | | | | | | | | | | | | | | | | | | | | | | | CoreLogic | | $ | 1,953 | | $ | 3,181 | | | 23 | % | — | | — | | — | | — | | | | | | | | | | | | | | | | | | | | | | | | | | | | Notes: | | | | | Data above reflects end of the most recently disclosed fiscal year. | | | | | (1) FY16 year-end financial results not yet released at the time of this report, Revenue & EBITDA data reflect 12-month trailing results. | | | | | (2) IHS completed a merger with Markit Ltd in July 2016. | | | | | | | | | | | | | | | | | | | | | | | | | |
The CommmitteeCommittee reviews executive officer pay relative to the median pay of comparable positions in peer groupPeer Group companies and, as appropriate, relevant survey data fromnationally-recognized consulting and data firms such as Willis Towers Watson, Mercer and Equilar, scoped to a comparable revenue size for us, from both general industry and the high technology sector. 2019 Peer Group Considerations Historically, the Company’s peer group has been challenging to construct as there are few firms that operate with highly comparable business mixes. Peers have generally been information and service providers, with some financial technology firms also included. For 2019, the Company refreshed its peer group to provide greater alignment with businesses that are sensitive to mortgage origination volumes and interest rates. As was evident in 2018, despite our diversification efforts, there continues to be a strong relationship between the Company’s stock performance and these volatile demand factors. The following organizations will be added to the 2019 compensation peer group: Fidelity National Information Services, Inc. Realogy Holdings Corporation Mr. Cooper Group, Inc. (Formerly Nationstar Mortgage Holdings) PennyMac Financial Services, Inc. MGIC Investment Corporation Altisource Portfolio Solutions Furthermore, four peers in the 2018 compensation peer group were acquired in 2018 and, therefore, will be removed: The new 2019 compensation peer group is intended to better reflect the Company’s business portfolio and provide greater alignment with mortgage origination volumes and interest rate movements. Base Salary
The Committee reviews base salaries annually and adjusts them, if appropriate, to recognize performance, changes to roles andpromotions, expansion in scope of responsibilities, and gaps relative to base salaries of similar individuals in the peer groupPeer Group and survey data described above. The Committee has not increased CEO base salary in five years. In an effort to To increase the weighting of variable,performance-based pay in the compensation mix, in recent years the Committee has in recent years withheld base salary increasesnot increased salaries for executive officers, withexcept where there has been a promotion, expansion of role and responsibilities, or to recognize performance.
In 2018, the exception of promotions or expansions of roles and responsibilities. The Committee has maintained this practice even in years of outstanding company performance. Mr. Nallathambi's base salary has not increased since 2011. The Committee increased the base salarysalaries for Mr. Martell and Mr. Balas, as both made major contributions to the successful execution of the Company’s strategic plan in 2016 in recognition of his promotion to Chief Financial Officer.2018. In addition, there were significant gaps between their salaries and the competitive market rate. No other NEOs
Table of Contents
NEO received a base salary increase in 2016 and no2018. Annualized base salaries were increased for 2017 other than Mr. Martell in connection with his promotion to President and Chief Executive Officer in March 2017. Base salaries of the executive officers for 2015, 20162017 and 20172018 are set forth in the table below:
| | | | | | | | | | | | | | | | | | | | | | | | | Named Executive Officer |
| 2015 |
| 2016 |
| 2017 |
| | | | | | | | | | | | | | | | | | | | | | | | | | | | Anand Nallathambi | | $800,000 | | $800,000 | | $800,000 | | | | | Frank D. Martell(1) | | $650,000 | | $650,000 | | $725,000 | | | | | James L. Balas(1) | | $350,000 | | $425,000 | | $425,000 | | | | | Barry M. Sando | | $550,000 | | $550,000 | | $550,000 | | | | | Stergios Theologides | | $425,000 | | $425,000 | | $425,000 | | | | | | | | | | | | | | |
(1)Mr. Balas received a base salary increase effective April 18, 2016 in connection with his promotion to Chief Financial Officer and Mr. Martell received a base salary increase effective March 6, 2017 in connection with his promotion to President and Chief Executive Officer.
| | | | | | | | | Named Executive Officer | | 2017 | | | 2018 | | Frank D. Martell | | $ | 725,000 | | | $ | 780,000 | | James L. Balas | | $ | 425,000 | | | $ | 450,000 | | Barry M. Sando | | $ | 550,000 | | | $ | 550,000 | | Arnold A. Pinkston (1) | | | — | | | $ | 425,000 | |
| (1) | Annual Bonus (ICP)Mr. Pinkston was hired in January 2018 as the Chief Legal Officer and Corporate Secretary.
|
Annual Incentives (ICP) The Incentive Compensation Plan (ICP)ICP rewards executive officers for financial and operating performance relative to rigorous, predetermined financial goals and strategic objectives. As part of our business planning process, management prioritizes a range of value drivers based on anticipated market demand including estimated mortgage origination volumes, prior year performance, business strategy and risk factors. The Committee then evaluates management'smanagement’s recommendations in light of stockholder expectations and establishes final ICP financial and strategic goals, including performance and payout range.ranges. 2018 Target Incentives.The Committee established the following 20162018 target bonus opportunities for our NEOs: | | | | | | | | | | | | | | | | | | | | | | | | | | | | | | | | | | | ICP Target Bonus | | | | | Name |
| Title |
| Base
Salary
($000s) |
| % of Salary |
| ($000s) |
| | | | | | | | | | | | | | | | | | Anand Nallathambi | | President and Chief Executive Officer | | $800 | | 125% | | $1,000 | | | | | Frank D. Martell | | Chief Operating Officer | | $650 | | 125% | | $ 813 | | | | | James L. Balas | | Chief Financial Officer | | $425 | | 90% | | $ 383 | | | | | Barry M. Sando | | Senior Executive Vice President, Group Executive, Risk Management and Workflow | | $550 | | 100% | | $ 550 | | | | | Stergios Theologides | | Senior Vice President, General Counsel and Secretary | | $425 | | 80% | | $ 340 | | | | | | | | | | | | | | | | |
| | | | | | | | | | | | | | | | | | | | | | | | | | | | | | | | | | | | ICP Bonus | | | | Name | | Title | | Base
Salary
($000s) | | % of
Salary | | Target
($000s) | | Maximum
($000s) | | | Frank D. Martell | | President and CEO | | | $ | 780 | | | | | 140 | % | | | $ | 1,092 | | | | $ | 2,184 | | | | James L. Balas | | Chief Financial Officer | | | $ | 450 | | | | | 100 | % | | | $ | 450 | | | | $ | 900 | | | | Barry M. Sando | | Managing Director, Underwriting and Workflow Solutions | | | $ | 550 | | | | | 100 | % | | | $ | 550 | | | | $ | 1,100 | | | | Arnold A. Pinkston | | Chief Legal Officer and Corporate Secretary | | | $ | 425 | | | | | 80 | % | | | $ | 340 | | | | $ | 680 | | | |
ICP Performance Metrics.For 2016,2018, the Committee selected the following three performance measures for the ICPICP: ➢Adjusted EBITDA — anon-GAAP — metric calculated as net income from continuing operations adjusted for interest, taxes, depreciation and amortization, stock compensation,non-operating gains/losses and other adjustments, as set forth in the Performance Unit Agreementadjustments.
Table of Contents
➢- Free Cash Flow — anon-GAAP
— metric calculated as net cash provided by continuing operating activities less capital expenditures for purchases of property and equipment, capitalized data and other intangible assets
assets.
The Committee selected these measures in order to reflect a balanced perspective on performance including growth, profitability and cash management. The Committee believes results for these measures drive stockholder value. the valuation of our stock. Please seeAppendix A for a detailed reconciliation of adjusted EBITDA adjusted EPS and free cash flowFCF to the most directly comparable GAAP financial measures.
Threshold Performance Requirement.
For 2016, no award was payable unless our 2016 adjusted net income exceeded the performance threshold of $55 million. The performance threshold was increased to $57.5 million for 2017. Calculation of Awards. For 2016,2018, 75% of the ICP opportunity was based on our financial performance goals and 25% on established strategic objectives for each executive officer in the three major planks of our business strategy: (1) grow and scale, (2) operational excellence, and (3) high performing organization. The Committee determined that these were the critical strategic initiatives for aligning annual operating performance with our long-term strategy.
officer. Results for achievement of revenue, adjusted EBITDA, and free cash flowFCF goals were weighted as follows in 2016:determining ICP funding: | | | | | Revenue | | | 3434% | % | Adjusted EBITDA | | | 3333% | % | Free Cash Flow | | | 3333% | % |
Threshold Performance Requirement.For 2018, no award was payable unless our 2018 adjusted net income exceeded $62.5 million. Funding FormulasFormula for Financial Results.At least 80% of targeted performance (threshold) for a metric must be achieved to generate any funding. At threshold, 34% offunding for that metric. The funding formula is set out in the target award is funded. At 120% of targeted performance (maximum), the maximum of 200% of the target award is funded.table below. For performance levels greater thanbetween threshold but less thanand target or between target and maximum, the bonus awardfunding is determined by linear interpolation. The funding formula parameters are set out in the following table: | | | | | | | | | | | | | | | | | | | | | | | | | | | | | | | | | | | | | | | | | | | | | |
Performance Level |
| | | Less than
Threshold |
| | | Threshold |
| | | Target |
| | | Maximum and Above |
| | | | | | | | | | | | | | | | | | | | | | | | | | | Performance as % of Target | | | | < 80% | | | | 80% | | | | 100% | | | | 120% | | | | | | Payout as a % of Target | | | | 0% | | | | 34% | | | | 100% | | | | 200% | | | | | | | | | | | | | | | | | | | | | | | | |
The sum of the weighted results of the three financial metrics funds the ICP awards. NEOs receive 75% of the funded amount based on financial results. The remaining 25% of the funded amount is earned based on evaluation of performance on strategic goals. Notwithstanding the actual ICP funding results, the Committee retains the discretion to decrease the actual payment for an ICP participant.
| | | | | | | | | | | | | | | | | Performance Level | | Less than
Threshold | | | Threshold | | | Target | | | Maximum
and Above | | Performance as % of Target | | | < 80% | | | | 80% | | | | 100% | | | | 120% | | Payout as a % of Target | | | 0% | | | | 34% | | | | 100% | | | | 200% | |
The sum of the weighted results of the three financial metrics funds the ICP awards. For 2018, NEOs received 75% of the funded amount based on financial results. Awards for the remaining 25% of the funded amount were based on an evaluation of performance on strategic goals. For outstanding performance on strategic objectives, the ICP structure permits the strategic goal payment percentage of up to 200% of target. Financial results were measured at the corporate level for NEOs except for Mr. Sando, whose financial results were weighted 33.3% on the corporate metrics previously outlined and 66.7% onsegment-level revenue and adjusted EBITDA results for the segment he manages. Funding for his strategic objectives component was determined by corporate results alone in alignment with the other NEOs. Determining Awards for Strategic Goal Achievement. 2016 executive officerThe Committee determined that three major areas of our business strategy should be used for ICP strategic objectives are measurable accomplishments which accelerategoals: (1) growth and innovation, (2) operational excellence, and (3) high performing organization. The Committee believed that these were the critical strategic focal areas for accelerating achievement of our long-term strategy andlong-strategy which are not otherwise measurable through annual financial performance metrics. Success indicators included top- and bottom-line growth, operational milestones and business and program innovation.
Table of Contents
The threshold level of the ICP adjusted net income goal must be achieved as a condition for funding awards for achievement of strategic objectives. As described above, the award opportunity for strategic goals flexes up or down based on overall financial results and funding, such that the portion of each executive officer's bonus tied to strategic objectives is aligned with our financial performance.
Awards for strategic goal achievement can range from a minimum of no payment to a maximum of 200% of the funded opportunity. The CEO provides the Committee with his assessment of individual results on strategic goals for the other executive officers and the Committee assesses the achievement level of the CEO. Based on these assessments, the Committee determines strategic goal achievement awards for each of the NEOs.
The following chart sets forth the steps in setting goals, measuring results and determining awards under the 2016 ICP:
2016 Incentive Compensation Plan Award Determination
| | | | | | | | | | | | Set Goals
|
| | | | | | | | | •
Management assesses market opportunities, strategic priorities, and investor expectations
| | | | | •
Management proposes ICP financial metrics, strategic priorities, and target performance levels
| | | | | •
Board of Directors reviews management proposals and establishes annual financial targets
| | | | | •
Compensation Committee establishes performance thresholds and maximums for financial metrics
| | | | | •
Compensation Committee establishes strategic goals for each NEO
| | | | | | | |

| | | | | | | | | | | | Calculate Funding
|
| | | | | | | | | •
Determine if Adjusted Net Income exceeds $55 million threshold
| | | | | •
Calculate overall funding from results on the three financial performance metrics, weighted as follows:
| | | | | -
Revenue: 34%
| | | | | -
Adjusted EBITDA: 33%
| | | | | -
Free Cash Flow: 33%
| | | | | | | |
| | | | | | | | | | | | Determine Individual Awards
|
| | | | | | | | | •
In the absence of a discretionary reduction in funding by the Compensation Committee:
| | | | | -
75% of funded amount is allocated to individuals for financial results
| | | | | -
0% to 200% of the remaining 25% of funded amount is allocated to NEOs based strategic goal results
| | | | | •
CEO assesses performance of other NEOs and recommends on payments for strategic goal results
| | | | | •
Committee assesses CEO performance and determines payments for all NEOs for strategic goal results
| | | | | | | |
Financial results were measured at the Corporate level for NEOs except for Mr. Sando. For Mr. Sando, funding for revenue and adjusted EBITDA was weighted 50% on corporate results and 50% on results for the RMW segment that he manages. Funding for his strategic objectives was determined by corporate results on adjusted EBITDA, in alignment with the other executive officers.
Table of Contents
The Committee established performance goals at the beginning of the year based on our 2016 operating plan and targeted performance. Over the course of the year, as the business evolved, we increased our guidance as we expected better-than-targeted performance based on an improved market environment. The 2016 targets included significant increases from 2015 actual results, other than for FCF, which was in line with 2015 actual results, but a significant increase from 2015 target. 2015 actual FCF results were $250 million, which exceeded the 2015 target of $178 million. For 2016, FCF was established in line with our long-term targeted rate of converting 50% of adjusted EBITDA into FCF. We outperformed targets across each of our financial measures, delivering strong growth in our core operations and continued success in cost-efficiency programs.
20162018 Financial Results and Funding.As set out in the table below, 20162018 corporate financial performance resulted in 146.3%96.7% of target funding. Because acquisition-related assumptions used in setting target performance did not meet timing expectations, management recommended and the Committee approved a 5% decrease in the 2016 ICP pool on an enterprise basis. This reduced the overall calculated bonus from 146% to 139% of target.
| | | | | | | | | | | | | | | | | | | | | | | | | | Financial Performance Metric | | Weight | | Target
($000) | | Actual 2018
Results
($000) | | Percentage
Achieved | | Funding
Percentage | 2018 Revenue | | | | 34% | | | | $ | 1,875 | | | | $ | 1,788 | | | | | 95.4% | | | | | 84.7% | | 2018 Adjusted EBITDA | | | | 33% | | | | $ | 480 | | | | $ | 493 | | | | | 102.7% | | | | | 113.5% | | 2018 Free Cash Flow | | | | 33% | | | | $ | 264 | | | | $ | 258 | | | | | 97.6% | | | | | 92.1% | | Total | | | | 100% | | | | | | | | | | | | | | | | | | | | 96.7% | |
| | | | | | | | | | | | | | | | | | | | | | | | | | | | | | | | | | | Financial Performance Metric |
| Weight |
|
| Target
($000) |
| Actual 2016
Results
($000) |
| Percentage
Achieved |
| Funding
Percentage |
| | | | | | | | | | | | | | | | | | | | | 2016 Revenue | | 34% | | |
$1,845 | | $1,954 | | 105.9% | | 129.3% | | | | | 2016 Adjusted EBITDA | | 33% | | | $490 | | $500 | | 102.0% | | 110.2% | | | | | 2016 Free Cash Flow | | 33% | | | $245 | | $333 | | 135.9% | | 200.0% | | | | | | | | | | | | | | | | | | | | | | Total | | 100% | | | | | | | | | 146.3% | | | | | | | | | | | | | | | | | | | |
Strategic Goal Results and Awards.For Messrs. Nallathambi,Martell, Balas, Sando and Martell,Pinkston, the Committee determined that each of these executive officers achieved hisdemonstrated performance above a targeted expectation on the achievement of strategic objectives at a level that either equaled or exceeded the level ofobjectives. An overarching factor was management’s success in achieving strong financial results achieved, and set each executive officer's bonus funding for achievementagainst the backdrop of the strategic objectives at 139%, the level that was funded based on financial results. The Committee elected to adjust Mr. Theologides' payout on strategic objectives downward by 19% and to increase the payout on strategic objectives by 11% for Mr. Sando. The table below summarizes the target and actual incentive bonus awards for each executive officer.a more difficult economic environment than had been anticipated. 2016 ICP Awards. The Committee approved the following ICP awards for performance in 2016:
| | | | | | | | | | | | | | | | | | | | | | | | | | | | | | | | | | | | | | | | | | | | | | | | | ICP Target | | Financial Results | | | | Individual Strategic Results | | | | ICP Award | Name | | ($000) | | % of Target | | 75% Weight | | | | % of Target | | 25% Weight | | | | % of Target | | Award ($000) | Frank D. Martell | | | $ | 1,092 | | | | | 96.7 | % | | | | 72.5 | % | | | | | | | | | 110 | % | | | | 27.5 | % | | | | | | | | | 100.0 | % | | | $ | 1,092 | | James L. Balas | | | $ | 450 | | | | | 96.7 | % | | | | 72.5 | % | | | | | | | | | 110 | % | | | | 27.5 | % | | | | | | | | | 100.0 | % | | | $ | 450 | | Barry M. Sando (1) | | | $ | 550 | | | | | 83.2 | % | | | | 62.4 | % | | | | | | | | | 131 | % | | | | 32.6 | % | | | | | | | | | 95.0 | % | | | $ | 523 | | Arnold A. Pinkston | | | $ | 340 | | | | | 96.7 | % | | | | 72.5 | % | | | | | | | | | 110 | % | | | | 27.5 | % | | | | | | | | | 100.0 | % | | | $ | 340 | |
All numbers represented in 000s
| | | | | | | | | | | | | | | | | | | | | | | | | | | | | | | | | | | Financial |
| Strategic Goals (25%) |
| Funded ICP Award |
| Actual Total ICP |
| | | | Name |
| Goals (75%)(1) |
| Funding |
| Actual |
| (Before Adjustment) |
| (Reduced to 95%) |
| | | | | | | | | | | | | | | | | | | | Anand Nallathambi | | $1,097 | | $366 | | $366 | | $1,463 | | $1,390 | | | | | Frank D. Martell | | $891 | | $297 | | $297 | | $1,188 | | $1,129 | | | | | James L. Balas | | $419 | | $140 | | $140 | | $559 | | $532 | | | | | Barry M. Sando(2) | | $554 | | $201 | | $224 | | $778 | | $740 | | | | | Stergios Theologides | | $373 | | $124 | | $101 | | $474 | | $450 | | | | | | | | | | | | | | | | | | |
(1)Reflects financial results prior to funding reduction.(2)Financial goals for Mr. Sando are calculated based on a 50/50 split between corporate targets and RMW segment revenue and EBITDA targets, together accounting for 75% of his total ICP award. Unadjusted funding results for the RMW segment were 122.6% of target.
Table of Contents
| (1) | Long-Term Incentives (LTI)Financial goals for Mr. Sando are calculated based on a split between corporate targets (25%) and segment revenue and adjusted EBITDA targets (50%), together accounting for 75% of his total ICP award. Unadjusted funding results for the segment were 92.8% of target resulting in blended achievement level of 86.5%.
|
Long-Term Incentives (LTI) Our long-term incentive compensationLTI program is designed to motivate and reward profitable growth and stockholder value creation through awards ofperformance-based andtime-vested equity. The Committee believes that usingperformance-based andtime-vesting equity vehicles reinforces both performance and retention of key executives while aligning their interests with those of our stockholders and encouraging an appropriate level ofrisk-taking. Long-term incentives represent the largest component of executive officer compensation. In 2016,2018, we granted 50% of total LTI value in PBRSUs, and 50% in RSUs. As outlined in more detail below, we also granted a special performance-based incentive ofone-times base salary for Messrs. Balas, Sando, and Pinkston, the A30 Awards, focused on achievement of aggressive EBITDA margin expansion from 2018 to 2020. In determining the amount of the equity compensation awarded to each executive officer, the Committee primarily considered company and individual performance. However, the Committee may also considerevaluate any factor it considers relevant including competencies, skills, prior experiences, scope of responsibility and accountability within the organization, and the long-term incentiveLTI awards made by peer groupPeer Group companies tosimilarly-situated executive officers. LTI Targets.The Committee established the following 20162018 LTI targets for our NEOs: | | | | | | | | | | | | | | | | | | | | | | | Base
Salary | | Target LTI | Name | | Title | | ($000s) | | % of Salary | | ($000s) | Frank D. Martell | | President and CEO | | | $ | 780 | | | | | 475 | % | | | $ | 3,705 | | James L. Balas | | Chief Financial Officer | | | $ | 450 | | | | | 200 | % | | | $ | 900 | | Barry M. Sando | | MD, Underwriting and Workflow Solutions | | | $ | 550 | | | | | 200 | % | | | $ | 1,100 | | Arnold A. Pinkston | | Chief Legal Officer and Corporate Secretary | | | $ | 425 | | | | | 200 | % | | | $ | 850 | |
| | | | | | | | | | | | | | | | | | | | | | | | | | | | | | | | | Base
Salary |
| Target LTI |
| | | | Name |
| Title |
| ($000s) |
| % of Salary |
| ($000s) |
| | | | | | | | | | | | | | | | | | Anand Nallathambi | | President and Chief Executive Officer | | $800 | | 535% | | $4,280 | | | | | Frank D. Martell | | Chief Operating Officer | | $650 | | 350% | | $2,275 | | | | | James L. Balas | | Chief Financial Officer | | $425 | | 150% | | $637.5 | | | | | Barry M. Sando | | Senior Executive Vice President, Group
Executive, Risk Management and Workflow | | $550 | | 200% | | $1,100 | | | | | Stergios Theologides | | Senior Vice President, General Counsel and Secretary | | $425 | | 200% | | $ 850 | | | | | | | | | | | | | | | | |
The following chart summarizes our LTI components for 2016:2018: | | | | | | | | | | | | | | | | | | LTI VEHICLE | | LTI VEHICLEWEIGHT | | WEIGHTOVERVIEW | PBRSUs | | OVERVIEW |
| | | 50% | | | | | | | | | | | PBRSUs• 3-year
| |
50%
| | Provides long-term focus on profitable growth and alignment with stockholders on share price
3-year measurement period using adjusted EPS growth goals
• Earn the greater number of shares from:
-
• Annual measurement against1-year targets and banking of earned shares
-
Cumulative• 3-year measurement against3-year targets
• Shares earned also subject to meeting 3-year vesting requirement
• Shares earned from adjusted EPS performance subject to modification based on 3-year TSR relative to our peers for1-year and3-year measurement periods | RSUs | | | | 50% | | | | | | | | | | | RSUs
| | 50%
| | Intended to encourage executive officer retention and alignment with stockholders on share price
• Vests in equal annual installments over 3 years | | | | | | | | | | | • Vesting subject to achievement of threshold level of adjusted net income |
Table of Contents
PBRSUs Granted in 2016.2018.The 20162018 PBRSUs are earned based on annual adjusted EPS achieved relative to annual targets for each of the three years of the performance period. Please see Appendix A for a detailed reconciliation of adjusted EBITDA, adjusted EPS and free cash flow to the most directly comparable GAAP financial measures.period 2018 through 2020. Shares earned are calculated as follows: ➢A portion of the PBRSUs may be earned each year. For the PBRSUs granted in 2016, 30% of the PBRSUs may be earned based on 2016 performance, 50% based on 2017 performance, and 20% based on 2018 performance. The number of PBRSUs earned is based on a schedule that provides for 50% of PBRSUs to be earned for annual adjusted EPS results at 80% of target (threshold) and 200% of PBRSUs to be earned for results at 120% of target (maximum). PBRSUs earned each year are accrued until the end of the three-year performance period.
➢Three-year cumulative adjusted EPS results are also compared to three-year cumulative targets with PBRSUs earned subject to the same schedule as for calculation of annual PBRSUs earned.
➢- described below. Participants earn the greater number of PBRSUs resulting from
the annual calculations for the three years of the performance periodStep 1 or from the three-year calculation.
Table of ContentsStep 2 (described in Step 3).
The number of PBRSUs earned is then subject to modification based on our relative total stockholder return compared to our 2016 peer group. The following table illustrates the 2016 PBRSU award calculation.
Step 1: Calculate Annual PBRSUs Earned Versus Target
Annually

| | | | | | | | | | | | | | | | | | | | | | | | | | | | | (A) PBRSUs Eligible to be Earned Based on Annual
Adjusted EPS Results (% of Total PBRSUs Granted) |
| | | | | | | | | | | | | | | | | | 2016 | | | | 2017 | | | | 2018 | | | | | | | | | | | | | | | | | | | 30% | | | | 50% | | | | 20% | | | | | | | | | | | | | | | | |
| | | | | | | | | | | | | | | | | | | | | (B) PBRSUs Earned Based on Adjusted EPS Results
|
| | | | | | | | | | | | | | Performance Level
| | Adjusted Annual EPS Results
(% of Target) | | Accrued PBRSUs Earned
(% of Target) | | | | | | | | | | | | | | | Less than Threshold | | < 80% | | 0% | | | | | Threshold | | 80% | | 50% | | | | | Target | | 100% | | 100% | | | | | Maximum+ | | 120% | | 200% | | | | | | | | | | | | |

| (A) | For the PBRSUs granted in 2018, 30% of the PBRSUs may be earned based on 2018 performance, 50% based on 2019 performance, and 20% based on 2020 performance. |
| | | | | (A) PBRSUs Eligible to be Earned Based on Annual Adjusted EPS Results (% of Total PBRSUs Granted) | 2018 | | 2019 | | 2020 | 30% | | 50% | | 20% |
| (B) | The number of PBRSUs earned is based on a schedule that provides for 50% of PBRSUs to be earned for annual adjusted EPS results at 80% of target (threshold), 100% of PBRSUs to be earned for results at 100% of target (target), and 200% of PBRSUs to be earned for results at 120% of target (maximum). |
| | | | | | | | | (B) PBRSUs Earned Based on Adjusted EPS Results | | Performance Level | | Adjusted Annual EPS
Results (% of Target) | | | Accrued PBRSUs
Earned (% of Target) | | Less than Threshold | | | < 80% | | | | 0% | | Threshold | | | 80% | | | | 50% | | Target | | | 100% | | | | 100% | | Maximum+ | | | 120% | | | | 200% | |
| (C) | The number of PBRSUs earned is then subject to modification based on our relative total stockholder return compared to our 2018 Peer Group (“TSR Modifier”). The TSR Modifier ensures alignment of PBRSU payouts and results for stockholders. | | | | | | |
| | | | | | | | | | | | | | | | | (C) TSR Modifier | PBRSUs Earned from
Adj. EPS Results (B)
| | Annual TSR (C) Relative TSR ModifierPerformance (Relative
to Peers)
|
| | | | | | | | | | | | | | | | | PBRSUs Earned from EPS Results (B)
| | | | Annual TSR Performance
(Relative to Peers) | | | | Modifier | | | | | | | | | | | | | | | | | | 150% to 200% of Target | | | | Top quartile | | 55 Percentile | | No modification | | | | | | | | | Below top quartile | | 55 Percentile | | Earnout capped at 150% of target | | | | | 50% to 150% of Target | | | | — | | | | No modifications | | | 0% | | 0%
| | | | Above peerPeer median | | | | Earnout is 50% of target | | | | | | | | | Below peerPeer median | | | | No earnout |
| (D) | | | | | | | | | | | | | | PBRSUs earned each year are accrued until the end of thethree-year performance period. |
The TSR modifier ensures alignment of PBRSU payouts and results for stockholders.
Step 2: Calculate PBRSUs Earned at End of3-Year EPS Results
Performance Period

Three-year calculations
Calculations of PBRSUs earned at the end of the3-year performance period use the same PBRSUschedules as for annual calculations: Adjusted EPS earnout schedule (calculation B above, based on aggregate resultsabove) measured using cumulative adjusted EPS over 3 years versus 3-year target) and relative to the3-year EPS target TSR modifierModifier schedule (calculation C above,above) measured over 3 years versus 3-year target) as for annual calculations. Step 3: PBRSUs earned equals the greater of cumulative PBRSUs earned in
each of the 3 annual calculations during the grant cycle (from Step 1) or overall
the3-year calculation (from Step 2)
Table of Contents
2018 Performance for 2018 PBRSU Grant.We achieved strong financial and operating results in 2016,2018 despite the macro-economic headwinds, as evidenced by adjusted EPS well above defined targetoutcomes at above-target performance levels. However, our TSR was not in the top quartile of the Peer Group. As a result, the PBRSUs earned for 2016 performance were capped at 150% of target, as illustrated below. | | | | | | | | | | | | | | | | | | | | | | | | | | | | | | | | | | | | | | | | | | | | | | | | | | | | | | | | | | | | | | | | | | | | | | 2016
Portion of
2016-2018
Performance
Period |
| | | % of Award
Subject
to Crediting in
2016 |
| | | Adj EPS
Target |
| | | Adj EPS
Results |
| | | % of
Adj EPS
Target
Achieved |
| | | Adj EPS
Performance
Level |
| | | % of Award
Subject to
Crediting for Adj EPS
Results |
| | | Adjusted for TSR
Modifier |
| | | | | | | | | | | | | | | | | | | | | | | | | | | | | | | | | | | | | | | 2016 | | | | 30% | | | | $2.18 | | | | $2.42 | | | | 111% | | | | 155% | | | | 47% | | | | 45% | | | | | | | | | | | | | | | | | | | | | | | | | | | | | | | | | | | | |
The calculation of PBRSUs granted in 2014 and which paid out after the end of the 2014-2016 performance period is presented in the table below. Three-year adjusted EPS results exceeded the total of the single-year achievements, and participants earned 124% of target PBRSUs.
| | | | | | | | | | | | | | | | | | | | | | | | | | | | | | | | | | | | | | | | | | | | | | | | | | | | | | | | | | | | | | | | | | | | | | | | | | | | | | 2014-2016
Performance
Period |
| | | % of Award
Subject
to Crediting |
| | | Adjusted
EPS
Target |
| | | Adj EPS
Results |
| | | % of
Adj EPS
Target
Achieved |
| | | Adj EPS
Performance
Level |
| | | % of Award
Subject to
Crediting
for Adj EPS
Results |
| | | Adjusted for TSR
Modifier |
| | | % Vesting |
| | | | | | | | | | | | | | | | | | | | | | | | | | | | | | | | | | | | | | | | | | | 2014 | | | | 30% | | | | $1.65 | | | | $1.33 | | | | 81% | | | | 0% | | | | 0% | | | | 0% | | | | 0% | | | | | | | | | | | | | | | | | | | | | | | | | | | | | | | | | | | | | | | | | | | | 2015 | | | | 60% | | | | $1.81 | | | | $1.90 | | | | 105% | | | | 133% | | | | 80% | | | | n/a | | | | 80% | | | | | | | | | | | | | | | | | | | | | | | | | | | | | | | | | | | | | | | | | | | | 2016 | | | | 10% | | | | $1.99 | | | | $2.42 | | | | 122% | | | | 200% | | | | 20% | | | | 15% | | | | 15% | | | | | | | | | | | | | | | | | | | | | | | | | | | | | | | | | | | | | | | | | | | | Total of 3 1 Year Achievements | | | | 100% | | | | | | | | | | | | | | | | | | | | | | | | | | | | 95% | | | | | | | | | | | | | | | | | | | | | | | | | | | | | | | | | | | | | | | | | | | | Cumulative 3 Year Achievement | | | | 100% | | | | $5.45 | | | | $5.65 | | | | 104% | | | | | | | | 124% | | | | n/a | | | | 124% | | | | | | | | | | | | | | | | | | | | | | | | | | | | | | | | | | | | | | | | |
The number of shares earnedperformance did not trigger a payout above 150%, there was no modification from the 2014 PBRSU award is presented in the table below.TSR Modifier.
| | | | | | | | | | | | | | | | | | | | | | | | 2014 PBRSU Grant (2016 Vesting) |
| | | | | Name |
| Target |
| Earned |
| | | | | | | | | | | | | | | Anand Nallathambi | | 56,940 | | 70,870 | | | | | | Frank D. Martell | | 16,928 | | 21,069 | | | | | | James L. Balas | | 3,077 | | 3,829 | | | | | | Barry M. Sando | | 15,389 | | 19,153 | | | | | | Stergios Theologides | | 8,079 | | 10,055 | | | | | | | | | | | | |
2016
| | | | | | | | | | | | | | | | | | | | | | | | | | | | | | | PBRSUs
Awarded
for 2018
Performance | | % of
Award
Subject
to Crediting in
2018 | | Adjusted
EPS
Target | | Adjusted
EPS
Results | | Adjusted
EPS
Performance | | % of
Award
Credited
for
Adjusted EPS
Results | | % of
Award
Credited
Adjusted for
TSR
Modifier | 2018 | | | | 30 | % | | | $ | 2.50 | | | | $ | 2.72 | | | | | 109 | % | | | | 43.20 | % | | | | 43.20 | % |
Restricted Stock Units.Units Granted in 2018.Vesting of RSUs granted in February 20162018 was subject to the achievement of $55$62.5 million in adjusted net income for 2016, which was achieved. For 2017 the performance threshold was increased to $57.5 million.2018. Adjusted net income results exceeded this threshold. RSUs vest in three equal installments on the first, second, and third anniversaries of the grant date. These awards encourage executive officer retention (as the vesting condition is continuous employment by the executive officer following the grant date) and align the interests of executive officers with those of stockholders (as the value increases or decreases with our stock price).stockholders. 2016
2018 Annual LTI Awards to NEOs.Awards.2018long-term 2016 long-term incentive awards were made at targettargeted grant value for each of the NEOs. As described earlier in this section, target awards were established relative to market medians, which provides a competitive long-term incentive opportunity while allowing for additional value to be earned if
Table of Contents
performance is strong. Details of the 20162018 grant awards are presented in the table below (with award amounts rounded to the nearest hundred).
| | | | | | | | | | | | | | | | | | | | | | | | 2016 Grants |
| | | | | Named Executive Officer |
| RSUs |
| PBRSUs(1) |
| | | | | | | | | | | | | | | Anand Nallathambi | | $2,140,000 | | $2,140,000 | | | | | | Frank D. Martell | | $1,137,500 | | $1,137,500 | | | | | | James L. Balas | | $319,000 | | $319,000 | | | | | | Barry M. Sando | | $550,000 | | $550,000 | | | | | | Stergios Theologides | | $425,000 | | $425,000 | | | | | | | | | | | | |
(1)PBRSU amount shown at target performance level. Based on 2016 | | | | | | | | | | | | 2018 Annual Grant Values | | Named Executive Officer | | RSUs | | | PBRSUs (1) | | Frank D. Martell | | $ | 1,852,500 | | | $ | 1,852,500 | | James L. Balas | | $ | 450,000 | | | $ | 450,000 | | Barry M. Sando | | $ | 550,000 | | | $ | 550,000 | | Arnold A. Pinkston | | $ | 425,000 | | | $ | 425,000 | |
| (1) | PBRSU amount shown at target performance level. Based on 2018 performance, the portion of the PBRSUs tied to 2018 performance will be eligible to vest contingent upon continued employment through December 31, 2020. |
PBRSUs Settled After 2018.PBRSUs granted in 2016 were paid out after the end of the PBRSUs tied to2016-2018 performance period. The calculation of the payout is presented in the table below.Three-year adjusted EPS resulted in above-target performance on both the annual and3-year calculation basis. As performance did not trigger a payout above 150% of target, there was no modification from the TSR Modifier and the payout was set at the3-year cumulative result of 141.07%. | | | | | | | | | | | | | | | | | | | | | | | | | | | | | | | | | | | | 2016-2018
PBRSU
Performance
Period | | % of Award
Subject to
Crediting for
Annual
Performance | | Adjusted
EPS
Target | | Adjusted
EPS
Results | | % of
Adjusted
EPS
Target
Achieved | | Adjusted
EPS
Performance | | % of Award
Subject to
Credit for
Adjusted
EPS
Results | | % Vesting-
Adjusted for
TSR
Modifier | 2016 | | | | 30 | % | | | $ | 2.18 | | | | $ | 2.42 | | | | | 111.01 | % | | | | 155.05 | % | | | | 46.5 | % | | | | 45.0 | % | 2017 | | | | 50 | % | | | $ | 2.31 | | | | $ | 2.37 | | | | | 102.60 | % | | | | 112.99 | % | | | | 56.5 | % | | | | 56.5 | % | 2018 | | | | 20 | % | | | $ | 2.45 | | | | $ | 2.72 | | | | | 111.02 | % | | | | 155.10 | % | | | | 31.0 | % | | | | 30.0 | % | Total of 31-Year Results | | | | 100 | % | | | | | | | | | | | | | | | | | | | | | | | | 134.0 | % | | | | 131.5 | % | 3-Year Results | | | | 100 | % | | | $ | 6.94 | | | | $ | 7.51 | | | | | 108.21 | % | | | | 141.07 | % | | | | | | | | | | |
The number of shares earned from the 2016 performance will be eligible to vest contingent upon continued employment through December 31, 2018.
| | | | | | | | | | | | | | 2016 PBRSU Grant — 2018 Vesting | Name | | Target | | Earned | Frank D. Martell | | | | 32,555 | | | | | 45,925 | | James L. Balas | | | | 9,129 | | | | | 12,878 | | Barry M. Sando | | | | 15,741 | | | | | 22,205 | |
Timing of Equity Grants.Awards.After Committee approval, we generally issue annual equity awards to executive officers on the second day on which the NYSE is open for trading following the filing of our Annual Report onForm 10-K, using the last sale price reported for a share of our common stock on the NYSE on that date. Grants to new hires or other grants outside the annual grant cycle follow the same methodology, except that awards are generally issued on the 20th day (or the next succeeding business day if the market is closed on the 20th day) of the third month of the calendar quarter that follows the date on which the Committee approved the awards. SpecialOne-Time A30 Award. In 2018, the Compensation Committee approved a specialone-time award (the “A30 Award”) to provide a focused incentive for achievement of an aggressive adjusted EBITDA margin expansion between 2018 and 2020. The award is also intended to enhance executive retention and promote the achievement of major strategic initiatives (e.g., workflow automation and adoption of related technologies). The specialone-time award was granted to senior leaders (including our NEOs but excluding the CEO) and leaders of our centers of excellence. For each of the NEO recipients, the target award value was equal to 1.0x the executive’s 2018 salary. The awards are presented in the table below for the NEO recipients. | | | | | | Name | | 2018 A30 Special Award
Target Value | James L. Balas | | | $ | 450,000 | | Barry M. Sando | | | $ | 550,000 | | Arnold A. Pinkston | | | $ | 425,000 | |
A30 Award Performance Metric and Targets. The A30 Award consists of units that are settled and vest at the end of 2020. Each unit converts to one share. The units have a target grant value equal to 100% of base salary and are earned based on achievement ofpre-determined 2020 adjusted EBITDA margin targets. 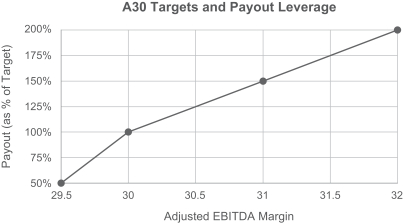
Retirement and Employee Benefit Plans |
Executive officers are entitled to the same benefits generally available to allfull-time employees (subject to fulfilling any minimum service requirement) including the 401(k) plan, health care,healthcare, life insurance and other welfare benefit programs. In designing these benefits, we seek to provide an overall level of benefits that is competitive with those offered by similar companies in the markets in which we operate. We believe that these employee benefits provide a valuable recruiting and retention mechanism for our executive officers and enable us to compete more successfully for qualified executive talent. Executive Supplemental Benefit Plan and the Pension Restoration Plan. Two of our executive officers — Messrs. Nallathambi andMr. Sando — became participantsa participant in our Executive Supplemental Benefit Plan (the "Executive“Executive Supplemental Benefit Plan"Plan”) prior to its closure to new participants in 2010. On November 18, 2010, we amended the Executive Supplemental Benefit Plan to freeze benefits effective as of December 31, 2010. As a result, compensation earned after 2010 is not taken into accountconsidered in determining covered compensation and final average compensation; service after 2010 is not recognized, except for vesting purposes. Mr. Sando is also a participant in the Pension Restoration Plan, which is limited to individuals who became participants before 1995. Explanation of these plans can be found in the Pension Benefits table below. Deferred Compensation Plan.The Deferred Compensation Plan is anon-qualified retirement plan that allows eligible participants to defer up to 80% of their salary and annual incentive bonus. Participation is limited to executive officers and certain other key employees. In 2010, we amended the Deferred Compensation Plan to provide additional Company contributions in the form of 401(k) restoration contributions and discretionary retirement savings contributions to a limited number of executive officers who were not eligible to participate in the Executive Supplemental Benefit Plan. Mr. Theologides received discretionary contributions in the amount of $85,000 in 2016.restoration. Other Benefits.We also maintain an executive life insurance program for executive officers and other key employees. This program provides the participant with up to two times their annualized base salary (up to a maximum of $1 million) in group universal life insurance. Further details regarding perquisites are found in the 20162018 Summary Compensation Table and accompanying footnotes.
TableRole of Contentsthe Committee and the Chief Executive Officer
Role of the Committee and the Chief Executive Officer
|
The Committee is composed solely of independent members of our Board. The Committee reviews and approves executive officer base salaries, annual incentive bonus programs,long-term incentive compensation and other incentive and executive benefit plans. The Committee, in consultation with its independent compensation consultant, analyzes the reasonableness of executive officer compensation, in part by reviewing compensation data from comparable companies and from relevant other industry sources. Decisions regarding compensation of the Chief Executive OfficerCEO are made solely by the Committee based on its deliberations with input from its independent compensation consultant. Decisions regarding other executive officers are made by the Committee after considering recommendations from the Chief Executive OfficerCEO as appropriate, as well as input from the Committee'sCommittee’s independent compensation consultant. Our Chief Executive Officer,CEO and, as appropriate, General Counsel, Chief OperatingLegal Officer, Chief Financial Officer and SVP,Chief Human Resources Officer, may attend the portion of the Committee'sCommittee’s meetings where individual executive officer performance is discussed. Only Committee members may vote on executive officer compensation decisions. The Committee regularly meets in executive session with its independent compensation consultant at most meetings.consultant. Role of Independent Compensation Consultant Role of Independent Compensation Consultant
|
The Committee retained Pay Governance LLC as its independent compensation consultant to advise on the executive officer compensation for 2016.2018. The independent compensation consultant generally advises the Committee on the appropriatenessall aspects of our compensation philosophy, peer group selection and generalthe executive compensation program design.design and governance process. During 2016,2018, as part of its engagement with the Committee, the independent compensation consultant: ➢advised on the selection of a peer group of companies for executive officer compensation comparison purposes;
➢provided guidance on industry best practices, and emerging trends and developments in executive officer compensation;
➢analyzed survey data;compensation, and
➢- investor views of compensation design and practices;
consulted on incentive design; advised on determining the total compensation of each of our executive officers and the material elements of total compensation, including (1) annual base salaries, (2) target cash bonus amounts, and (3) the structure and target amount oflong-term incentive awards.awards; Consulted onnon-employee director compensation; and, Assisted on a compensation risk assessment. The Committee retained its independent compensation consultant directly, although in carrying out assignments, the consultant also interacted with Company management toon behalf of the extent necessary and appropriate.Committee. Pay Governance performed no services for the Company, and the Committee does not believe the independent compensation consultants'consultant’s work has raised any conflict of interest. The Committee has the sole authority to select, retain, and terminate the independent compensation consultants. Adjustment or Recovery of Awards(Claw-backs) Adjustment or Recovery of Awards (Clawbacks)
|
In 2012, the Committee formally adopted new compensation policies and provisions to further improve alignment with best practices. We adoptedThe Company maintains a recoupment provisions which allow us to recover policy that enables recovery ofperformance-based compensation to the extent that it is later determined that applicable performance goals were not actually achieved due totaking into account a financial restatement or ethical misconduct. We also addedclaw-backs in termination agreements for all executive officers. This policy applies to allperformance-based incentive
Table of Contents
plans including but not limited to the annual incentive cash bonus andperformance-based equity awards described above.
Anti-Hedging and Pledging Policy Anti-Hedging and Pledging Policy
|
The Company maintains a policy that prohibits executive officer transactions in put options, call options or other derivative securities, on an exchange or in any other organized market as well as holding Company securities in a margin account or otherwise pledging Company securities as collateral for a loan. Executive Stock Ownership Guidelines and Retention Requirements Executive Stock Ownership Guidelines and Retention Requirements
|
We require our executive officers to own a fixed amount of our stock. The rigorous guidelines are based on a multiple of base salary as outlined below: | | | | | | | | | | | | | | | | | | Position | | Position | | | | Ownership Guidelines
|
| | | | Chief Executive Officer | | | | 6x base salary | | | | | | | | | | | | | | Chief Operating Officer | | | | 4x base salary (increased from 3x in 2016) | | | | | | | | | | | | | | Chief Financial Officer | | | | 3x base salary | | | | | | | | | | | | | | Senior EVP, Group Executive | | Managing Directors | | 3x base salary | | | | | | | | | | | | | | Other Executive Officers | | | | 1x base salary | | | | | | | | | | | |
Covered officers have five years from their date of hire or promotion to the covered position to reach the ownership requirement. All Company securities owned outright or earned and subject only totime-based vesting restrictions count toward the requirement; stock options do not count toward the ownership requirement. Furthermore, we have adopted a share retention requirement which provides that all covered executives must hold at least 50% of net (after tax) shares until the stock ownership guidelines described above are achieved. All NEOs have met their ownership requirements. Actual Share Ownership vs. Minimum Share Ownership Requirement
(As multiple of base salary) 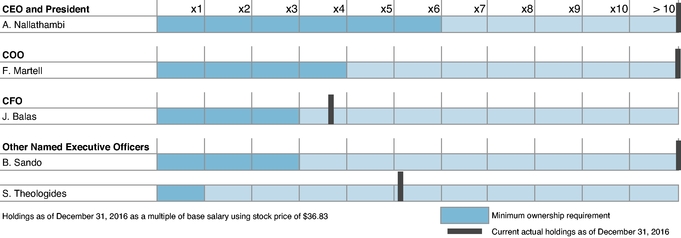
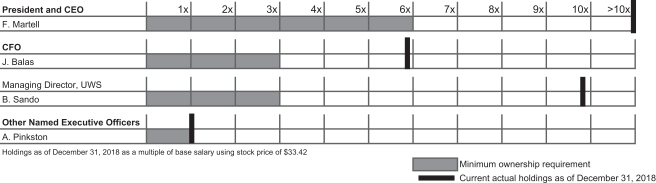
President and CEO 1x 2x 3x 4x 5x 6x 7x 8x 9x 10x >10x F. Martell CFO J. Balas Managing Director, UWS B. Sando Other Named Executive Officers A. Pinkston Holdings as of December 31, 2018 as a multiple of base salary using stock price of $33.42 Minimum ownership requirement Current actual holdings as of December 31, 2018 Employment Agreements and Severance Arrangements |
Each currently employed executive officer is party to an employment agreement with us. The Committee believes that offering employment agreements to key executive officers is consistent with peer practices and serves as an
Table of Contents
effective retention tool. Each agreement is individually negotiated and terms may vary. For additional information regarding the terms of the employment agreements, including severance arrangements that we have entered into with our executive officers see "Employment Agreements"“Employment Agreements” below. Change in Control Agreements Change in Control Agreements
|
All equityEquity awards are grantedcurrently issued under the 2018 Plan, which was approved by our stockholders at our annual meeting held in May 2018. Prior to the approval of the 2018 Plan, we issued share-based awards under the 2011 Performance Incentive Plan, (the "2011 Plan"), as amended. The 2011 Plan doesand 2018 Plan do not include an automatic "single trigger"“single trigger” change in control vesting provision. Instead, the "double trigger" provides forboth plans include a change in control provision where automatic
accelerated vesting of an award in connection with a change in control will only occur if an acquirer or successor to us fails to assume or continue the awards or the awards otherwise do not survive the transaction. Additionally, award agreements include "double-trigger"“double-trigger” severance protections and provide for accelerated vesting of awards that remain outstanding following a change in control transaction in the event of a termination without cause following a change in control. The Deferred Compensation Plan generally provides for accelerated vesting of awards or benefits, as the case may be, in the event of a change in control of the Company. In addition, the Executive Supplemental Benefit Plan provides that when a participant incurs an involuntary separation from service without good cause subsequent to a change in control, payment of benefits will commence in the same manner and in the same amount as if the participant had attained his or her normal retirement age on the date of termination. In addition to the plan and award agreement provisions described above, we have entered into a change in control agreement (a "Change“Change in Control Agreement"Agreement”) with each of our executive officers.NEOs. Under the Change in Control Agreement, a "change“change in control"control” means the consummation of any one of the following: •a merger or consolidation of the Company in which our stockholders end up owning less than 50% of the voting securities of the surviving entity;
•the sale, transfer or other disposition of all or substantially all of our assets or the complete liquidation or dissolution of the Company;
•a change in the composition of our Board of Directors over atwo-year period as a result of which fewer than a majority of the directors are incumbent directors, as defined in the agreement; or
•the acquisition or accumulation by any person or group, subject to certain limited exceptions, of at least 30% of our voting securities. In addition, ifIf the termination of theour executive officer'sofficer’s employment occurs without cause or if the executive officer terminates his employment for good reason within the twenty-four monthtwenty-four-month period following a change in control, we will pay the following benefits in one lump sum in the month following the month in which the date of the termination occurs:
•the executive officer'sofficer’s base salary through and including the date of termination and any accrued but unpaid annual incentive bonus;
•between two and three times the executive officer'sofficer’s target annual cash bonus amount established for the fiscal year in which the termination occurs; and
•between two and three times the executive officer'sofficer’s annual base salary in effect immediately prior to the date of termination. Furthermore, under the Change in Control Agreement, for a period ranging fromtwenty-four tothirty-six months and subject to the covered executive officer'sofficer’s continued payment of the same percentage of the applicable
Table of Contents
premiums as the executive officer was paying immediately prior to the date of termination or, if more favorable to the executive officer, at the time at which the change in control occurred, we will provide medical and dental coverage pursuant to COBRA for the executive officer (and if applicable, the executive officer'sofficer’s dependents). To the extent that the executive officer cannot participate in the plans previously available, we will provide such benefits on the sameafter-tax basis as if they had been available. These obligations are reduced by any welfare benefits made available to the executive officer from subsequent employers. The Change in Control Agreement provides that if any excise tax imposed by Section 4999 of the Code (or any similar tax), applies to the payments, benefits or other amounts payable under the agreement or otherwise, including without limitation, any acceleration of the vesting of outstanding stock options, restricted stock or performance shares (collectively, the "Total Payments"“Total Payments”), then the Total Payments will be reduced (but not below zero) so that the maximum amount of the Total Payments (after reduction) will be $1.00 less than the amount which would cause the Total Payments to be subject to the excise tax; provided that such reduction to the Total Payments will be made only if theafter-tax benefit to the executive officer is greater after giving effect to such reduction than if no such reduction had been made. This type of provision is often referred to as a "modified “modifiedcut-back,"” and is included because the Change in Control Agreement does not provide for any type of "gross up"“gross up” or similar benefit.
The Change in Control Agreement had an initial term through December 31, 2011 and is automatically extended for additionalone-year periods unless either party notifies the other not later than the preceding January 1 that it does not wish to extend the term for an additional year. All agreements with current executive officers have since been extended through December 31, 2016.2019. For a description of the calculations and further explanation of the payments due to the executive officers upon termination of employment and/or a change in control, see Potential Payments upon Termination or Change in Control tables below. Impact of Tax and Accounting Impact of Tax and Accounting
|
As a general matter, the Committee takes into accountconsiders the various tax and accounting implications of the compensation vehicles we employ. When determining amounts oflong-term incentive grants to executive officers and employees, the Committee examines the accounting cost associated with the grants. Under accounting guidance, grants of stock options, RSUs and PBRSUs result in an accounting charge for the Company. The accounting charge is equal to the fair value of the instruments being issued. For RSUs, the cost is generally equal to the fair value of the stock on the date of grant times the number of shares granted. This expense is amortized over the requisite service period. With respect to stock options, we calculate the fair value of the option and take that value into account as an expense over the vesting period, after adjusting for possible forfeitures. For PBRSUs, we calculate the fair value of the award upon grant and adjust the value to be expensed on a quarterly basis over the performance period based on expected award payouts, after adjusting for possible forfeitures. Section 162(m) of the Code generally prohibits any publicly held corporationapublicly-held company from taking a federal income tax deduction for compensation paid in excess of $1 million in any taxable year to each of the chief executive officer and certain of the other most highly compensated executive officers. Exceptions are made for qualified performance-based compensation, among other things. RSUs, PBRSUs and performance units granted to executive officers have been structured in a manner intended to qualify under this exception for performance-based compensation. As such, RSUs and ICP awards are earned contingent upon our achievement of adjusted net income for 2016 of $55 million or more, which performance target was achieved. PBRSUs are earned contingent upon our achievement of the adjusted EPS levels and relative TSR results described above. Other compensation may be subject to the $1 million deduction limit. We generally intend to seek to qualify most of the variablededucting compensation paid to oura current or former NEO that exceeds $1.0 million during the tax year. Certain awards granted before November 2, 2017 that were based upon attainingpre-established performance measures that were set by the Committee under a plan approved by the Company’s stockholders, as well as amounts payable to former executive officers pursuant to a written binding contract that was in effect on November 2, 2017, may qualify for an exception to the "performance-based compensation" exemption from$1.0 million deductibility limit. As one of the deduction limit. As such,factors in approving the amount and formits consideration of compensation for our executive officers,matters, the Committee considers all elementsnoted this deductibility limitation. However, the Committee has the flexibility to take anycompensation-related actions that it determines are in the best interests of the cost.Company and our stockholders, including awarding compensation that may not be deductible for tax purposes. There can be no assurance that any compensation will in fact be deductible.
Table of Contents
COMPENSATION COMMITTEE REPORT COMPENSATION COMMITTEE REPORT |
The Compensation Committee has reviewed and discussed the foregoing CD&A with management. Based on its review and discussions, the Compensation Committee has recommended to the Board that the CD&A be included in the Company'sCompany’s Annual Report onForm 10-K for the year ended December 31, 2016,2018 and in the Company'sCompany’s proxy statement for its 2017 annual meeting2019 Annual Meeting of stockholders. | | | Members of the Compensation Committee J. David Chatham, Chair Paul F. Folino Claudia Fan Munce Thomas C. O’Brien Jaynie Miller Studenmund | | Members of the Compensation Committee
| | | J. David Chatham, Chair
Paul F. Folino
Thomas C. O'Brien
Jaynie Miller Studenmund
|
COMPENSATION COMMITTEE INTERLOCKS AND INSIDER PARTICIPATION COMPENSATION COMMITTEE INTERLOCKS AND INSIDER PARTICIPATION |
Messrs. Chatham (Chair), Folino, O'BrienO’Brien and Ms.Mmes. Munce and Studenmund served on the Compensation Committee during 2016.2018. No person who served as a member of the Compensation Committee during 20162018 was or is an officer or employee of the Company. No executive officer of the Company serves or served as a director or member of the compensation committee of another company who employed or employs any member of the Company'sCompany’s Compensation Committee or the Board.
Table of Contents
EXECUTIVE COMPENSATION TABLES
EXECUTIVE COMPENSATION TABLES |
20162018 Summary Compensation Table
The following table sets forth certain information concerning compensation of each named executive officer who served as such during the fiscal years ended December 31, 2016, 20152018, 2017 and 2014,2016, other than for Mr. Balas,Pinkston, for whom compensation information is provided only for the fiscal year ended December 31, 2016,2018, the firstonly year thatin which he becamewas a named executive officer. The positions listed below are as of December 31, 2016.2018. | | | | | | | | | | | | | | | | | | | | | | | | | | | | | | | | | | | | | | | | | | | | |
| |
| |
| |
| |
| |
| |
| |
| |
| |
| |
| |
| |
| |
| |
| |
| |
| |
| |
|
|---|
| | | | | | | | | | | | | | | | | | | | | | | | | | | | | | | | | | | | | | | | | | | | | | | | |
Name and
Principal Position
|
| | |
|
Year |
| | |
|
Salary |
| | |
|
Stock
Awards |
| | |
|
Option
Awards |
| | |
|
Non-Equity
Incentive Plan
Compensation |
| | |
| Change in
Pension Value
and
Nonqualified
Deferred
Compensation
Earnings |
| | |
|
All Other
Compensation |
| | |
|
Total |
| | | | | | | | | | | | | | | | | | | | | | | | | | | | | | | | | | | | | | | | | | | | | | | | | | | | | | | | (3) | | | | | (4) | | | | | (5) | | | | | (6) | | | | | (7) | | | | | (8) | | | | | | | | | | | | | | | | | | | | | ($) | | | | | ($) | | | | | ($) | | | | | ($) | | | | | ($) | | | | | ($) | | | | | | | | | | | | | | | | | | | | | | | | | | | | | | | | | | | | | | | | | | | | | | | | | | | | | | | | | | | | | | Anand Nallathambi | | | | | 2016 | | | | | 800,000 | | | | | 4,279,940 | | | | | — | | | | | 1,390,030 | | | | | 386,990 | | | | | 78,609 | | | | | 6,935,569 | | | | | | | | | | | | | | | | | | | | | | | | | | | | | | | | | | | | | | | | | | | | | | | | | | | | President and Chief | | | | | 2015 | | | | | 800,000 | | | | | 3,699,990 | | | | | — | | | | | 1,477,400 | | | | | — | | | | | 89,197 | | | | | 6,066,587 | | | | | | | | | | | | | | | | | | | | | | | | | | | | | | | | | | | | | | | | | | | | | | | | | | | | Executive Officer (1) | | | | | 2014 | | | | | 800,000 | | | | | 2,959,969 | | | | | 827,452 | | | | | 985,075 | | | | | 1,049,258 | | | | | 43,288 | | | | | 6,665,042 | | | | | | | | | | | | | | | | | | | | | | | | | | | | | | | | | | | | | | | | | | | | | | | | | | | | Frank D. Martell | | | | | 2016 | | | | | 650,000 | | | | | 2,274,943 | | | | | — | | | | | 1,129,400 | | | | | — | | | | | 61,490 | | | | | 4,115,833 | | | | | | | | | | | | | | | | | | | | | | | | | | | | | | | | | | | | | | | | | | | | | | | | | | | | Chief Operating Officer (1) | | | | | 2015 | | | | | 650,000 | | | | | 1,624,975 | | | | | — | | | | | 1,200,400 | | | | | — | | | | | 74,139 | | | | | 3,549,514 | | | | | | | | | | | | | | | | | | | | | | | | | | | | | | | | | | | | | | | | | | | | | | | | | | | | | | | | | 2014 | | | | | 600,000 | | | | | 879,959 | | | | | 245,990 | | | | | 800,380 | | | | | — | | | | | 31,330 | | | | | 2,557,659 | | | | | | | | | | | | | | | | | | | | | | | | | | | | | | | | | | | | | | | | | | | | | | | | | | | | James Balas | | | | | 2016 | | | | | 396,538 | | | | | 637,935 | | | | | — | | | | | 531,700 | | | | | — | | | | | 24,714 | | | | | 1,590,887 | | | | | | Chief Financial Officer (2) | | | | | | | | | | | | | | | | | | | | | | | | | | | | | | | | | | | | | | | | | | | | | | | | | | | | | | | | | | | | | | | | | | | | | | | | | | | | | | | | | | | | | | | | | | | | Barry M. Sando | | | | | 2016 | | | | | 550,000 | | | | | 1,099,981 | | | | | — | | | | | 740,000 | | | | | 378,594 | | | | | 51,503 | | | | | 2,820,078 | | | | | | | | | | | | | | | | | | | | | | | | | | | | | | | | | | | | | | | | | | | | | | | | | | | | Senior Executive Vice | | | | | 2015 | | | | | 540,192 | | | | | 1,099,963 | | | | | — | | | | | 730,000 | | | | | | | | | | 63,949 | | | | | 2,434,104 | | | | | | | | | | | | | | | | | | | | | | | | | | | | | | | | | | | | | | | | | | | | | | | | | | | | President, Group Executive, Risk Management and Workflow | | | | | 2014 | | | | | 500,000 | | | | | 799,969 | | | | | 223,635 | | | | | 492,540 | | | | | 1,349,113 | | | | | 31,571 | | | | | 3,396,828 | | | | | | | | | | | | | | | | | | | | | | | | | | | | | | | | | | | | | | | | | | | | | | | | | | | | Stergios Theologides | | | | | 2016 | | | | | 425,000 | | | | | 849,950 | | | | | — | | | | | 450,000 | | | | | — | | | | | 115,500 | | | | | 1,840,450 | | | | | | | | | | | | | | | | | | | | | | | | | | | | | | | | | | | | | | | | | | | | | | | | | | | | Senior Vice President, | | | | | 2015 | | | | | 410,000 | | | | | 637,439 | | | | | — | | | | | 502,400 | | | | | — | | | | | 125,511 | | | | | 1,675,350 | | | | | | | | | | | | | | | | | | | | | | | | | | | | | | | | | | | | | | | | | | | | | | | | | | | | General Counsel & Secretary | | | | | 2014 | | | | | 350,000 | | | | | 419,966 | | | | | 117,406 | | | | | 295,830 | | | | | — | | | | | 85,204 | | | | | 1,268,406 | | | | | | | | | | | | | | | | | | | | | | | | | | | | | | | | | | | | | | | | | | | | | | | | |
(1)Mr. Nallathambi was granted a temporary leave of absence on February 13, 2017 and passed away on March 2, 2017. Effective March 6, 2017, the Board appointed Mr. Martell to the position of President and Chief Executive Officer and principal executive officer.
(2)James Balas was appointed Chief Financial Officer on April 8, 2016. Mr. Martell served as Chief Financial Officer during 2016 prior to the appointment of Mr. Balas.
(3)Amounts include any amounts electively deferred by the named executive officer under the Company's Deferred Compensation Plan. All employees are paid bi-weekly and 2015 payments included one additional payroll.
Table of Contents
(4)For 2016, reflects the aggregate grant date fair value of stock awards, consisting of RSUs and PBRSUs, computed in accordance with the Financial Accounting Standards Board's Accounting Standards Codification Topic 718, Compensation-Stock Compensation. We valued the RSUs as of the grant date by multiplying the closing price of our common stock on that date by the number of RSUs awarded. We valued the PBRSUs as of the grant date by multiplying the closing price of our common stock on that date by the target number of PBRSUs that will vest upon achievement of the target performance. The RSUs were granted and vest contingent upon the satisfaction of certain performance criteria through December 31, 2016, which criteria were satisfied, and thereafter vest based on continued employment through December 31, 2018. The PBRSUs were granted and vest contingent upon satisfaction of certain performance criteria and continued employment through December 31, 2018. If the highest performance target is met or exceeded, the value of the awards at grant date would be as follows: Mr. Nallathambi — $6,419,910; Mr. Martell — $3,412,415; Mr, Balas — $956,902; Mr. Sando — $1,649,972; and Mr. Theologides — $1,274,926.
(5)The Company did not grant stock options in 2015 or 2016.
(6)For 2016, represents the annual incentive bonus that was paid to each named executive officer, and includes any amounts electively deferred by the named executive officer under the Company's Deferred Compensation Plan.
(7)For 2016, represents the change in the present value of the life annuity from the end of fiscal year 2015 to the end of fiscal year 2016 for the Executive Supplemental Benefit Plan with respect to Messrs. Nallathambi and Sando, and the Pension Restoration Plan with respect to Mr. Sando only. The amounts in this column do not include earnings under the Company's deferred compensation plan as such earnings were neither above-market nor preferential. See the Pension Benefits table below under "Pension Benefits for 2016" | | | | | | | | | | | | | | | | | | | | | | | | | | | | | | | | | | | | | | | | | | Name and Principal Position | | Year | | | Salary | | | Stock
Awards | | | Option
Awards | | | Non-Equity
Incentive Plan
Compensation | | | Change in
Pension Value
and
Nonqualified
Deferred
Compensation
Earnings | | | All Other
Compensation | | | Total | | | | | | | | (3) ($) | | | (4) ($) | | | (5) ($) | | | (6) ($) | | | (7) ($) | | | (8) ($) | | | ($) | | Frank D. Martell | | | 2018 | | | | 778,942 | | | | 3,704,964 | | | | — | | | | 1,092,000 | | | | — | | | | 65,748 | | | | 5,641,654 | | President and Chief Executive Officer (1) | | | 2017 | | | | 710,577 | | | | 3,262,445 | | | | — | | | | 1,250,000 | | | | — | | | | 61,177 | | | | 5,284,199 | | | | | 2016 | | | | 650,000 | | | | 2,274,943 | | | | — | | | | 1,129,400 | | | | — | | | | 61,490 | | | | 4,115,833 | | James L. Balas | | | 2018 | | | | 449,519 | | | | 1,349,905 | | | | — | | | | 450,000 | | | | — | | | | 30,856 | | | | 2,280,280 | | Chief Financial Officer | | | 2017 | | | | 425,000 | | | | 849,992 | | | | — | | | | 525,000 | | | | — | | | | 31,411 | | | | 1,831,401 | | | | | | 2016 | | | | 396,538 | | | | 637,935 | | | | — | | | | 531,700 | | | | — | | | | 24,714 | | | | 1,590,887 | | Barry M. Sando | | | 2018 | | | | 550,000 | | | | 1,649,903 | | | | — | | | | 522,500 | | | | — | | | | 50,556 | | | | 2,772,959 | | Managing Director, Underwriting & Workflow Solutions | | | 2017 | | | | 550,000 | | | | 1,099,985 | | | | — | | | | 690,000 | | | | 634,144 | | | | 52,523 | | | | 3,026,652 | | | | | 2016 | | | | 550,000 | | | | 1,099,981 | | | | — | | | | 740,000 | | | | 378,594 | | | | 51,503 | | | | 2,820,078 | | Arnold A. Pinkston Chief Legal Officer & Corporate Secretary (2) | | | 2018 | | | | 415,192 | | | | 1,274,903 | | | | — | | | | 340,000 | | | | — | | | | 12,847 | | | | 2,042,943 | |
| (1) | Effective March 6, 2017, the Board appointed Mr. Martell to the position of President and Chief Executive Officer and principal executive officer. |
| (2) | Arnold A. Pinkston was appointed Chief Legal Officer & Corporate Secretary on January 2, 2018. |
| (3) | Amounts include any amounts electively deferred by the NEO under the Deferred Compensation Plan. |
| (4) | For 2018, reflects the aggregate grant date fair value of stock awards, consisting of RSUs and PBRSUs, computed in accordance with the Financial Accounting Standards Board’s Accounting Standards Codification Topic 718,Compensation-Stock Compensation. We valued the RSUs as of the grant date by multiplying the closing price of our common stock on that date by the number of RSUs awarded. We valued the PBRSUs as of the grant date by multiplying the closing price of our common stock on that date by the target number of PBRSUs that will vest upon achievement of the target performance. The RSUs were granted and vest contingent upon the satisfaction of certain performance criteria through December 31, 2018, which criteria were satisfied, and thereafter vest based on continued employment through December 31, 2020. The PBRSUs were granted and vest contingent upon satisfaction of certain performance criteria and continued employment through December 31, 2020. If the highest performance target is met or exceeded, the value of the awards at grant date would be as follows: Mr. Martell $3,704,964; Mr. Balas $1,799,880; Mr. Sando $2,199,861; and Mr. Pinkston $1,699,856. |
| (5) | The Company did not grant stock options in 2016, 2017 or 2018. |
| (6) | For 2018, represents the annual incentive bonus that was paid to each NEO and includes any amounts electively deferred by the NEO under the Deferred Compensation Plan. |
| (7) | For 2018, the change in the present value of the life annuity from the end of fiscal year 2017 to the end of fiscal year 2018 for the Executive Supplemental Benefit Plan and the Pension Restoration Plan with respect to Mr. Sando only decreased due to an increase in the interest rate assumptions and is therefore excluded The actual change in the present values is as follows: ($411,002) under the Executive Supplemental Benefit Plan and ($8,715) under the Pension Restoration Plan. The amounts in this column do not include earnings under the Deferred Compensation Plan as such earnings were neitherabove-market nor preferential. See the Pension Benefits table below under “Pension Benefits for 2018” for assumptions used in calculating these amounts.
(8)Amounts included in all other compensation consist of the amounts shown in the table below paid by the Company for each NEO and, for Mr. Theologides includes $85,000 in Company discretionary contributions to the Deferred Compensation Plan. Amounts also include for Mr. Nallathambi a total of $4,976 for travel costs for his spouse and miscellaneous imputed income. | | | | | | | | | | | | | | | | | | | | | | | | | | | | | | | | | | | | | | | | | | | | | | | | | | | | | | | | | | | | | | | | Named Executive Officer
|
| | |
| Life Insurance
Premiums
($)
|
| | |
| 401(k) Matching
Contributions
($)
|
| | |
| Amounts Deferred
under the Deferred
Compensation Plan
($)
|
| | |
| Health Savings
Account
($)
|
| | |
| Total
($)
|
| | | | | | | | | | | | | | | | | | | | | | | | | | | | | | | | | | | | Anand Nallathambi | | | | | 4,211 | | | | | 7,950 | | | | | 60,372 | | | | | 1,100 | | | | | 73,633 | | | | | | | | | | | | | | | | | | | | | | | | | | | | | | | | | | | | | Frank D. Martell | | | | | 4,878 | | | | | 7,950 | | | | | 47,562 | | | | | 1,100 | | | | | 61,490 | | | | | | | | | | | | | | | | | | | | | | | | | | | | | | | | | | | | | James Balas | | | | | 1,218 | | | | | 7,950 | | | | | 14,446 | | | | | 1,100 | | | | | 24,714 | | | | | | | | | | | | | | | | | | | | | | | | | | | | | | | | | | | | | Barry M. Sando | | | | | 12,003 | | | | | 7,950 | | | | | 30,450 | | | | | 1,100 | | | | | 51,503 | | | | | | | | | | | | | | | | | | | | | | | | | | | | | | | | | | | | | Stergios Theologides | | | | | 1,578 | | | | | 7,950 | | | | | 104,872 | | | | | 1,100 | | | | | 115,500 | | | | | | | | | | | | | | | | | | | | | | | | | | | | | | | | | |
Table of Contents
Grants of Plan-Based Awards for 2016
|
| (8) | Amounts included in all other compensation consist of the amounts shown in the table below paid by the Company for each NEO. |
| | | | | | | | | | | | | | | | | Named Executive Officer
| | Life
Insurance
Premiums
($) | | | 401(k)
Matching
Contributions
($) | | | Amounts Deferred
under the Deferred
Compensation
Plan ($) | | | Total
($) | | Frank D. Martell | | | 4,878 | | | | 8,250 | | | | 52,618 | | | | 65,748 | | James L. Balas | | | 1,620 | | | | 8,250 | | | | 20,986 | | | | 30,856 | | Barry M. Sando | | | 13,356 | | | | 8,250 | | | | 28,950 | | | | 50,556 | | Arnold A. Pinkston | | | 3,963 | | | | 5,884 | | | | 3,000 | | | | 12,847 | |
Grants ofPlan-Based Awards for 2018 The following table sets forth information concerningon awards made to each of the NEOs under the ICP, 2011 Plan and the 2018 Plan during 2016. | | | | | | | | | | | | | | | | | | | | | | | | | | | | | | | | | | | | | | | | | | | | | | | | | | | | | | | | | | | | | | | | | | | | | | | | | | | | | | | | | | | | | | | | | | | | | | | | | | | | | | | | | | | |
| Estimated Future Payouts
Under Non-Equity Incentive Plan Awards(1)
|
| | |
| Estimated Future Payouts
Under Equity Incentive Plan Awards(2)
|
| | | | | | | | | | | | | | | | | | | | | | | | | | | | | | | | | | | | | | | | | | | | | | | | | | | | | | | | | | | | | Name
|
| | |
| Approval
Date
|
| | |
| Grant
Date
|
| | |
| Threshold
($)
|
| | |
| Target
($)
|
| | |
| Maximum
($)
|
| | |
| Threshold
(#)
|
| | |
| Target
(#)
|
| | |
| Maximum
(#)
|
| | |
| Grant
Date Fair
Value of
Stock &
Option
Awards
(3)
($)
|
| | | | | | | | | | | | | | | | | | | | | | | | | | | | | | | | | | | | | | | | | | | | | | | | | | | | | | | | Anand Nallathambi | | | | | | | | | | | | | | | | | | | | | | | | | | | | | | | | | | | | | | | | | | | | | | | | | | | | | | | | | | | | | | | | | | | | | | | | | | | | | | | | | | | | | | | | | | | | | | | | | | | | | | Annual Bonus — Performance Units | | | | | 2/23/2016 | | | | | 2/23/2016 | | | | | 340,000 | | | | | 1,000,000 | | | | | 2,000,000 | | | | | | | | | | | | | | | | | | | | | | | | | | | | | | | | | | | | | | | | | | | | | | | | | | | | | | | | | | | | | | | | | | | | | | | | | | | | | RSUs | | | | | 2/23/2016 | | | | | 3/1/2016 | | | | | | | | | | | | | | | | | | | | | | | | | 61,247 | | | | | | | | | | 2,139,970 | | | | | | | | | | | | | | | | | | | | | | | | | | | | | | | | | | | | | | | | | | | | | | | | | | | | | | | | | PBRSUs | | | | | 2/23/2016 | | | | | 3/1/2016 | | | | | | | | | | | | | | | | | | | | 30,623 | | | | | 61,247 | | | | | 122,494 | | | | | 2,139,970 | | | | | | | | | | | | | | | | | | | | | | | | | | | | | | | | | | | | | | | | | | | | | | | | | | | | | | | | | Frank D. Martell | | | | | | | | | | | | | | | | | | | | | | | | | | | | | | | | | | | | | | | | | | | | | | | | | | | | | | | | | | | | | | | | | | | | | | | | | | | | | | | | | | | | | | | | | | | | | | | | | | | | | | Annual Bonus — Performance Units | | | | | 2/23/2016 | | | | | 2/23/2016 | | | | | 276,250 | | | | | 812,500 | | | | | 1,625,000 | | | | | | | | | | | | | | | | | | | | | | | | | | | | | | | | | | | | | | | | | | | | | | | | | | | | | | | | | | | | | | | | | | | | | | | | | | | | | RSUs | | | | | 2/23/2016 | | | | | 3/1/2016 | | | | | | | | | | | | | | | | | | | | | | | | | 32,555 | | | | | | | | | | 1,137,472 | | | | | | | | | | | | | | | | | | | | | | | | | | | | | | | | | | | | | | | | | | | | | | | | | | | | | | | | | PBRSUs | | | | | 2/23/2016 | | | | | 3/1/2016 | | | | | | | | | | | | | | | | | | | | 16,277 | | | | | 32,555 | | | | | 65,110 | | | | | 1,137,472 | | | | | | | | | | | | | | | | | | | | | | | | | | | | | | | | | | | | | | | | | | | | | | | | | | | | | | | | | James Balas | | | | | | | | | | | | | | | | | | | | | | | | | | | | | | | | | | | | | | | | | | | | | | | | | | | | | | | | | | | | | | | | | | | | | | | | | | | | | | | | | | | | | | | | | | | | | | | | | | | | | | Annual Bonus — Performance Units | | | | | 4/29/2016 | | | | | 4/29/2016 | | | | | 130,050 | | | | | 382,500 | | | | | 765,000 | | | | | | | | | | | | | | | | | | | | | | | | | | | | | | | | | | | | | | | | | | | | | | | | | | | | | | | | | | | | | | | | | | | | | | | | | | | | | RSUs | | | | | 2/23/2016 | | | | | 3/1/2016 | | | | | | | | | | | | | | | | | | | | | | | | | 9,129 | | | | | | | | | | 318,967 | | | | | | | | | | | | | | | | | | | | | | | | | | | | | | | | | | | | | | | | | | | | | | | | | | | | | | | | | PBRSUs | | | | | 2/23/2016 | | | | | 3/1/2016 | | | | | | | | | | | | | | | | | | | | 4,564 | | | | | 9,129 | | | | | 18,258 | | | | | 318,967 | | | | | | | | | | | | | | | | | | | | | | | | | | | | | | | | | | | | | | | | | | | | | | | | | | | | | | | | | Barry M. Sando | | | | | | | | | | | | | | | | | | | | | | | | | | | | | | | | | | | | | | | | | | | | | | | | | | | | | | | | | | | | | | | | | | | | | | | | | | | | | | | | | | | | | | | | | | | | | | | | | | | | | | Annual Bonus — Performance Units | | | | | 2/23/2016 | | | | | 2/23/2016 | | | | | 187,000 | | | | | 550,000 | | | | | 1,100,000 | | | | | | | | | | | | | | | | | | | | | | | | | | | | | | | | | | | | | | | | | | | | | | | | | | | | | | | | | | | | | | | | | | | | | | | | | | | | | RSUs | | | | | 2/23/2016 | | | | | 3/1/2016 | | | | | | | | | | | | | | | | | | | | | | | | | 15,741 | | | | | | | | | | 549,991 | | | | | | | | | | | | | | | | | | | | | | | | | | | | | | | | | | | | | | | | | | | | | | | | | | | | | | | | | PBRSUs | | | | | 2/23/2016 | | | | | 3/1/2016 | | | | | | | | | | | | | | | | | | | | 7,870 | | | | | 15,741 | | | | | 31,482 | | | | | 549,991 | | | | | | | | | | | | | | | | | | | | | | | | | | | | | | | | | | | | | | | | | | | | | | | | | | | | | | | | | Stergios Theologides | | | | | | | | | | | | | | | | | | | | | | | | | | | | | | | | | | | | | | | | | | | | | | | | | | | | | | | | | | | | | | | | | | | | | | | | | | | | | | | | | | | | | | | | | | | | | | | | | | | | | | Annual Bonus — Performance Units | | | | | 2/23/2016 | | | | | 2/23/2016 | | | | | 115,600 | | | | | 340,000 | | | | | 680,000 | | | | | | | | | | | | | | | | | | | | | | | | | | | | | | | | | | | | | | | | | | | | | | | | | | | | | | | | | | | | | | | | | | | | | | | | | | | | | RSUs | | | | | 2/23/2016 | | | | | 3/1/2016 | | | | | | | | | | | | | | | | | | | | | | | | | 12,163 | | | | | | | | | | 424,975 | | | | | | | | | | | | | | | | | | | | | | | | | | | | | | | | | | | | | | | | | | | | | | | | | | | | | | | | | PBRSUs | | | | | 2/23/2016 | | | | | 3/1/2016 | | | | | | | | | | | | | | | | | | | | 6,081 | | | | | 12,163 | | | | | 24,326 | | | | | 424,975 | | | | | | | | | | | | | | | | | | | | | | | | | | | | | | | | | | | | | | | | | | | | | | | | | | | | | |
(1)Amounts reflect each NEO's maximum annual incentive bonus opportunity for 2016, while the actual incentive bonus earned by each NEO is reported in the 2016 Summary Compensation Table above. NEOs can earn less than maximum, but not amounts greater than maximum. At threshold, a NEO would receive 17% of the maximum award amount and at target the NEO would receive 50% of the maximum award amount. Please see Compensation Discussion and Analysis — Annual Incentive Bonus above for a discussion of the material terms of our 2016 incentive bonus program.
(2)Equity Awards in 2016 consisted of RSUs and PBRSUs granted as part of the 2016 long-term incentive compensation program. The RSUs are tied to achievement of at least $55 million in 2016 adjusted net income. For the RSUs, if as was the case, the adjusted net income performance target is met, the shares vest in three equal installments on the first three anniversaries of the grant date. In the case of the PBRSUs, 100% of each award is tied to achievement of certain adjusted earnings-per-share targets over a three-year performance period consisting of the 2016-2018 fiscal years, subject to modification based on our relative total stockholder return achieved during the performance period. The PBRSUs that were earned in 2016 based on 2016 adjusted EPS performance and relative total stockholder return will vest and be payable to the NEOs subject to their continued employment through December 31, 2018. Please see Compensation Discussion and Analysis — Long-Term Incentives above for a discussion of the material terms of our 2016 awards of RSUs and PBRSUs.
(3)These amounts represent the aggregate grant date fair value of each award determined pursuant to Financial Accounting Standards Board's Accounting Standards Codification Topic 718, Compensation-Stock Compensation. For the assumptions and methodologies used to value these awards, see footnote (4) to the 2016 Summary Compensation Table above.
Table of Contents
| | | | | | | | | | | | | | | | | | | | | | | | | | | | | | | | | | | | | | | | | | | | | | Estimated Future
Payouts
Under Non-Equity
Incentive Plan
Awards (1) | | | Estimated Future
Payouts
Under Equity
Incentive Plan
Awards (2) | | | Grant
Date Fair
Value of
Stock &
Option | | | | | | | | | | | | Name | | Approval
Date | | | Grant
Date | | | Threshold
($) | | | Target
($) | | | Maximum
($) | | | Threshold
(#) | | | Target
(#) | | | Maximum
(#) | | | Awards
(3)($) | | Frank D. Martell | | 2018 ICP Award | | | | | | | | | | | 371,280 | | | | 1,092,000 | | | | 2,184,000 | | | | | | RSUs | | | 2/20/2018 | | | | 3/1/2018 | | | | | | | | | | | | | | | | | | | | 40,696 | | | | | | | | 1,852,482 | | PBRSUs | | | 2/20/2018 | | | | 3/1/2018 | | | | | | | | | | | | | | | | 20,348 | | | | 40,696 | | | | 81,392 | | | | 1,852,482 | | James Balas | | 2018 ICP Award | | | | | | | | | | | 153,000 | | | | 450,000 | | | | 900,000 | | | | | | RSUs | | | 2/20/2018 | | | | 3/1/2018 | | | | | | | | | | | | | | | | | | | | 9,885 | | | | | | | | 449,965 | | PBRSUs | | | 2/20/2018 | | | | 3/1/2018 | | | | | | | | | | | | | | | | 4,943 | | | | 9,885 | | | | 19,770 | | | | 449,965 | | A30 Award (4) | | | 7/30/2018 | | | | 9/20/2018 | | | | | | | | | | | | | | | | 4,442 | | | | 9,885 | | | | 17,768 | | | | 449,975 | | Barry M. Sando | | 2018 ICP Award | | | | | | | | | | | 187,000 | | | | 550,000 | | | | 1,100,000 | | | | | | RSUs | | | 2/20/2018 | | | | 3/1/2018 | | | | | | | | | | | | | | | | | | | | 12,082 | | | | | | | | 549,973 | | PBRSUs | | | 2/20/2018 | | | | 3/1/2018 | | | | | | | | | | | | | | | | 6,041 | | | | 12,082 | | | | 24,164 | | | | 549,973 | | A30 Award (4) | | | 7/30/2018 | | | | 9/20/2018 | | | | | | | | | | | | | | | | 5,429 | | | | 10,858 | | | | 21,716 | | | | 549,958 | | Arnold A. Pinkston | | 2018 ICP Award | | | | | | | | | | | 115,600 | | | | 340,000 | | | | 680,000 | | | | | | RSUs | | | 2/20/2018 | | | | 3/1/2018 | | | | | | | | | | | | | | | | | | | | 9,336 | | | | | | | | 424,975 | | PBRSUs | | | 2/20/2018 | | | | 3/1/2018 | | | | | | | | | | | | | | | | 4,668 | | | | 9,336 | | | | 18,672 | | | | 424,975 | | A30 Award (4) | | | 7/30/2018 | | | | 9/20/2018 | | | | | | | | | | | | | | | | 4,195 | | | | 8,390 | | | | 16,780 | | | | 424,954 | |
| (1) | At threshold performance, a NEO would receive 34% of the target award amount and at maximum performance, a NEO would receive 200% of the target award amount. Actual incentive award earned by each NEO is reported in the 2018 Summary Compensation Table. |
| (2) | Equity awards in 2018 consisted of RSUs and PBRSUs granted as part of the 2018Employment Agreementslong-term incentive compensation program. The RSUs are tied to achievement of at least $62.5 million in 2018 adjusted net income. For the RSUs, if as was the case, the adjusted net income performance target is met, the shares vest in three equal installments on the first three anniversaries of the grant date. In the case of the PBRSUs, 100% of each award is tied to achievement of certain adjustedearnings-per-share targets over athree-year performance period consisting of the2018-2020 fiscal years, subject to modification based on our relative total stockholder return achieved during the performance period. The PBRSUs that were earned in 2018 based on 2018 adjusted EPS performance and relative total stockholder return will vest and be payable to the NEOs subject to their continued employment through December 31, 2020. |
In May 2011,
| (3) | These amounts represent the aggregate grant date fair value of each award determined pursuant to Financial Accounting Standards Board’s Accounting Standards Codification Topic 718,Compensation-Stock Compensation. For the assumptions and methodologies used to value these awards, see footnote (4) to the 2018 Summary Compensation Table above. |
| (4) | PBRSUs were granted as a specialone-time A30 Award to our NEOs, excluding the CEO, on September 20, 2018 and remain subject to the achievement of certain performance measures. The amount set forth in this column represents the estimated future payout of the A30 Awards assuming the target performance goal of 30% adjusted EBITDA margin has been achieved. The PBRSUs vest, if at all, based on achievement ofpre-determined 2020 adjusted EBITDA margin targets. “See Compensation Discussion and Analysis—Long-Term Incentives” above for detailed discussion of the A30 Awards. |
Employment Agreements Effective March 6, 2017, we entered into employment agreements with Anand Nallathambi, Barry M. Sando and Stergios Theologides, and effective June 16, 2014 and October 6, 2014, we amended thea new employment agreement with Mr. Sando. On July 20, 2011, we entered into an employment agreement with Frank Martell, which was amended effective June 16, 2014superseded the prior agreement and April 8, 2016.amendments thereto. On April 8, 2016, we entered into an employment agreement with Mr. Balas. On MarchIn May 2011, we entered into an employment agreement with Mr. Sando, as amended June 16, 2014 and October 6, 2014. Effective January 2, 2017,2018, we entered into an employment agreement with Mr. Nallathambi passed away, which resulted in the termination of his employment agreement.Pinkston. The material terms of the employment agreements, which are substantially similar in form, are as follows: •| • | | Term: One-year term through December 31 of each calendar year, with automatic renewal for an additional year unless either party provides 60 days prior written notice before the expiration of the current term. Neither party to the NEO employment agreements provided such notice in 2016, and accordingly the term of each automatically extended through December 31, 2017.
•Pay: Sets initial base salary at current salary at the time the agreement was entered into or amended and provides that base salary will be reviewed annually and may be increased (but not decreased) during the term at our discretion.
•Severance: Provides for severance pay if the NEO is terminated without "cause" as defined in the employment agreement. The severance amount is a multiple of base pay and target annual bonus. For Messrs. Martell and Sando, the multiple is two and COBRA reimbursement is provided for 24 months. For Messrs. Balas and Theologides the multiple is one and COBRA reimbursement is provided for 12 months. The NEOs are also entitled to receive payment of a pro-rata portion of any annual bonus actually earned based on performance that they would have otherwise received had their employment not terminated.
•Severance Payment Timing: Severance will be paid in installments as follows:
•- One-year term through December 31 of each calendar year, with automatic renewal for an additional year unless either party provides 60 days prior written notice before the expiration of the current term. Neither party to the NEO employment agreements provided such notice in 2018, and accordingly the term of each automatically extended through December 31, 2019.
|
| • | | Pay:Sets initial base salary at current salary at the time the agreement was entered into or amended and provides that base salary will be reviewed annually and may be increased (but not decreased) during the term at our discretion. |
| • | | Severance:Provides for severance pay if the NEO is terminated without “cause” as defined in the employment agreement. The severance amount is a multiple of base pay and target annual bonus. For Messrs. Martell and Sando, the multiple is two and COBRA reimbursement is provided for 24 months. For Messrs. Balas and Pinkston, the multiple is one and COBRA reimbursement is provided for 12 months. The NEOs are also entitled to receive payment of apro-rata portion of any annual bonus actually earned based on performance that they would have otherwise received had their employment not terminated. |
| • | | Severance Payment Timing:Severance will be paid in installments as follows: |
Messrs. Martell and Sando — First payment is made in the seventh month after separation of employment and is 7/24th24th of the total severance and equal installments thereafter for the remainder;
•Messrs. Balas and TheologidesPinkston — First payment is made in the seventh month after separation of employment and is 7/12th12th of the total severance and equal installments thereafter for the remainder.
•Release of Liability: The employment agreement requires the NEO to sign a release in exchange for severance. Moreover, the NEOs are covered by restrictive covenants such as confidentiality, cooperation in litigation, non-disparagement, non-solicitation and non-competition.
•Clawbacks: The employment agreement provides that the agreement is subject to "clawback" under applicable law or under our clawback policy in effect from time to time. We adopted such a recoupment or "clawback" policy in March 2012 as further described in the Compensation Discussion and Analysis — Adjustment or Recovery of Awards (Clawbacks).
Table of Contents
| • | | Outstanding Equity Awards at Fiscal Year-EndRelease of Liability:The employment agreement requires the NEO to sign a release in exchange for 2016severance. Moreover, the NEOs are covered by restrictive covenants such as indefinite confidentiality, cooperation in litigation andnon-competition.
|
| • | | Claw-backs:The employment agreement provides that the agreement is subject to“claw-back” under applicable law or under ourclaw-back policy in effect from time to time. We adopted such a recoupment or“claw-back” policy in March 2012 as further described in “Compensation Discussion and Analysis—Adjustment or Recovery of Awards (Claw-backs)”. |
Outstanding Equity Awards at FiscalYear-End for 2018 The following table shows outstanding equity awards held by our NEOs as of December 31, 2016. | | | | | | | | | | | | | | | | | | | | | | | | | | | | | | | | | | | | | | | | | | | | | | | | | | | | | | | | | | | | | | |
| Option Awards |
|
| Stock Awards |
| | | | Name | | | Number of
Securities
Underlying
Unexercised
Options
Exercisable(1)
(#) | | | Number of
Securities
Underlying
Unexercised
Options
Unexercisable(1)
(#) | | | Option
Exercise
Price(1)
($) | | | Option
Expiration
Date(2) | | | Number of
Shares or
Units of Stock
That Have Not
Vested
(#) | | | Market
Value of
Shares or
Units of
Stock That
Have Not
Vested(3)
($) | | |
Equity
Incentive
Plan
Awards:
Number of
Unearned
Shares,
Units or
Other Rights
That Have
Not Vested
(#) | | | Equity
Incentive Plan
Awards:
Market or
Payout Value
of Unearned
Shares, Units
or Other
Rights That
Have Not
Vested
($) | | | | | | | | | | | | | | | | | | | | | | | | | | | | | | | | | | | Anand Nallathambi | | | 101,530 | | | | | | 26.36 | | | 2/22/2017 | (4) | | | | | | | | | | | | | | | | | | | 50,765 | | | | | | 23.61 | | | 3/30/2017 | (4) | | | | | | | | | | | | | | | | | | | 227,878 | | | | | | 18.76 | | | 5/31/2020 | | | | | | | | | | | | | | | | | | | | 62,645 | | | | | | 17.24 | | | 3/15/2021 | | | | | | | | | | | | | | | | | | | | 104,516 | | | | | | 15.50 | | | 3/1/2022 | | | | | | | | | | | | | | | | | | | | 119,653 | | | — | | | 25.95 | | | 2/26/2023 | | | | | | | | | | | | | | | | | | | | 45,552 | | | 22,776 | | | 32.49 | | | 3/2/2024 | (5) | | | | | | | | | | | | | | | | | | | | | | | | | | | | | | | 11,388 | (6) | | 419,420 | | | | | | | | | | | | | | | | | | | | | | | | | | 70,870 | (7) | | 2,610,142 | | | | | | | | | | | | | | | | | | | | | | | | | | 36,750 | (8) | | 1,353,503 | | | | | | | | | | | | | | | | | | | | | | | | | | 66,150 | (9) | | 2,436,305 | | | | | | | | | | | | | | | | | | | | | | | | | | 61,247 | (10) | | 2,255,727 | | | | | | | | | | | | | | | | | | | | | | | | | | 27,561 | (11) | | 1,015,072 | | | | | | | | | | | | | | | | | | | | | | | | | | | | | | | | 11,025 | (12) | | 406,051 | | | | | | | | | | | | | | | | | | | | | | | | | | 42,872 | (13) | | 1,578,976 | | | | | | | | | | | | | | | | | | | | | | | | | | | | | | | | | | | Frank D. Martell | | | 116,298 | | | | | | 11.35 | | | 8/29/2021 | | | | | | | | | | | | | | | | | | | | 63,870 | | | | | | 15.50 | | | 3/1/2022 | | | | | | | | | | | | | | | | | | | | 38,150 | | | | | | 25.95 | | | 2/26/2023 | | | | | | | | | | | | | | | | | | | | 13,542 | | | 6,771 | | | 32.49 | | | 3/2/2024 | (5) | | | | | | | | | | | | | | | | | | | | | | | | | | | | | | | 3,386 | (6) | | 124,706 | | | | | | | | | | | | | | | | | | | | | | | | | | 21,069 | (7) | | 775,971 | | | | | | | | | | | | | | | | | | | | | | | | | | 16,140 | (8) | | 594,436 | | | | | | | | | | | | | | | | | | | | | | | | | | 29,052 | (9) | | 1,069,985 | | | | | | | | | | | | | | | | | | | | | | | | | | 32,555 | (10) | | 1,199,001 | | | | | | | | | | | | | | | | | | | | | | | | | | 14,649 | (11) | | 539,523 | | | | | | | | | | | | | | | | | | | | | | | | | | | | | | | | 4,842 | (12) | | 178,331 | | | | | | | | | | | | | | | | | | | | | | | | | | 22,788 | (13) | | 839,282 | | | | | | | | | | | | | | | | | | | | | | | | | | | | | | | | | | | James Balas | | | 7,732 | | | | | | 11.38 | | | 9/27/2021 | | | | | | | | | | | | | | | | | | | | 8,709 | | | | | | 15.50 | | | 3/1/2022 | | | | | | | | | | | | | | | | | | | | 7,803 | | | | | | 25.95 | | | 2/26/2023 | | | | | | | | | | | | | | | | | | | | 2,462 | | | 1,231 | | | 32.49 | | | 3/2/2024 | (5) | | | | | | | | | | | | | | | | | | | | | | | | | | | | | | | 616 | (6) | | 22,687 | | | | | | | | | | | | | | | | | | | | | | | | | | 3,829 | (7) | | 141,022 | | | | | | | | | | | | | | | | | | | | | | | | | | 2,582 | (8) | | 95,095 | | | | | | | | | | | | | | | | | | | | | | | | | | 4,647 | (9) | | 171,149 | | | | | | | | | | | | | | | | | | | | | | | | | | 9,129 | (10) | | 336,221 | | | | | | | | | | | | | | | | | | | | | | | | | | 4,108 | (11) | | 151,298 | | | | | | | | | | | | | | | | | | | | | | | | | | | | | | | | 774 | (12) | | 28,506 | | | | | | | | | | | | | | | | | | | | | | | | | | 6,390 | (13) | | 235,344 | | | | | | | | | | | | | | | | | | | | | | | | | | | | | | | | | | | Barry M. Sando | | | 17,401 | | | | | | 17.24 | | | 3/15/2021 | | | | | | | | | | | | | | | | | | | | 22,532 | | | | | | 15.50 | | | 3/1/2022 | | | | | | | | | | | | | | | | | | | | 26,011 | | | | | | 25.95 | | | 2/26/2023 | | | | | | | | | | | | | | | | | | | | 12,311 | | | 6,156 | | | 32.49 | | | 3/2/2024 | (5) | | | | | | | | | | | | | | | | | | | | | | | | | | | | | | | 3,078 | (6) | | 113,363 | | | | | | | | | | | | | | | | | | | | | | | | | | 19,153 | (7) | | 705,405 | | | | | | | | | | | | | | | | | | | | | | | | | | 10,926 | (8) | | 402,405 | | | | | | | | | | | | | | | | | | | | | | | | | | 19,665 | (9) | | 724,262 | | | | | | | | | | | | | | | | | | | | | | | | | | 15,741 | (10) | | 579,741 | | | | | | | | | | | | | | | | | | | | | | | | | | 7,083 | (11) | | 260,867 | | | | | | | | | | | | | | | | | | | | | | | | | | | | | | | | 3,277 | (12) | | 120,692 | | | | | | | | | | | | | | | | | | | | | | | | | | 11,018 | (13) | | 405,793 | | | | | | | | | | | | | | | | | | | | | | | | | | | | | | | | |
Table of Contents
| | | | | | | | | | | | | | | | | | | | | | | | | | | | | | | | | | | | | | | | | | | | | | | | | | | | | | | | | | | | | | |
| Option Awards |
|
| Stock Awards |
| | | | Name | | | Number of
Securities
Underlying
Unexercised
Options
Exercisable(1)
(#) | | | Number of
Securities
Underlying
Unexercised
Options
Unexercisable(1)
(#) | | | Option
Exercise
Price(1)
($) | | | Option
Expiration
Date(2) | | | Number of
Shares or
Units of Stock
That Have Not
Vested
(#) | | | Market
Value of
Shares or
Units of
Stock That
Have Not
Vested(3)
($) | | |
Equity
Incentive
Plan
Awards:
Number of
Unearned
Shares,
Units or
Other Rights
That Have
Not Vested
(#) | | | Equity
Incentive Plan
Awards:
Market or
Payout Value
of Unearned
Shares, Units
or Other
Rights That
Have Not
Vested
($) | | | | | | | | | | | | | | | | | | | | | | | | | | | | | | | | | | | Stergios Theologides | | | 35,980 | | | | | | 18.76 | | | 5/31/2020 | | | | | | | | | | | | | | | | | | | | 18,792 | | | | | | 17.24 | | | 3/15/2021 | | | | | | | | | | | | | | | | | | | | 25,403 | | | | | | 15.50 | | | 3/1/2022 | | | | | | | | | | | | | | | | | | | | 18,208 | | | | | | 25.95 | | | 2/26/2023 | | | | | | | | | | | | | | | | | | | | 6,463 | | | 3,232 | | | 32.49 | | | 3/2/2024 | (5) | | | | | | | | | | | | | | | | | | | | | | | | | | | | | | | 1,616 | (6) | | 59,517 | | | | | | | | | | | | | | | | | | | | | | | | | | 10,055 | (7) | | 370,326 | | | | | | | | | | | | | | | | | | | | | | | | | | 6,332 | (8) | | 233,208 | | | | | | | | | | | | | | | | | | | | | | | | | | 11,396 | (9) | | 419,715 | | | | | | | | | | | | | | | | | | | | | | | | | | 12,163 | (10) | | 447,963 | | | | | | | | | | | | | | | | | | | | | | | | | | 5,473 | (11) | | 201,571 | | | | | | — | | | | | | | | | | | | | | | | | | | | | | | | | | 1,899 | (12) | | 69,940 | | | | | | | | | | | | | | | | | | | | | | | | | | 8,514 | (13) | | 313,571 | | | | | | | | | | | | | | | | | | | | | | | | | | | | | | | | |
(1)On June 1, 2010, in connection with spinning off the businesses now known as First American Financial Corporation, all outstanding stock option awards granted to Company employees were adjusted in a manner designed to preserve the intrinsic value of the stock option awards.
(2)The stock options disclosed in this table have a ten-year life. As of December 31, 2016, all stock options were fully vested with the exception of stock options granted in 2014.
(3)Represents the value of unvested RSUs based on our closing stock price on December 31, 2016 of $36.83.
(4)These amounts represent stock options to purchase shares of our common stock arising from the conversion of FADV stock options that were previously issued to Mr. Nallathambi and that were converted in connection with our acquisition of the publicly-traded shares of FADV. As required by the applicable plan documents, as a result of that transaction, all unvested FADV stock options immediately vested.
(5)These stock options were granted on March 3, 2014 and vest in three equal annual installments on the first, second and third anniversary of the grant date.
(6)These RSUs represent the unvested portion of RSUs that were granted to the NEOs on March 3, 2014 which were subject to (i) the achievement of adjusted net income of $50 million for 2014 and (ii) time vesting in three equal annual installments on the first, second and third anniversaries of the grant date. We achieved the $50 million performance measure for 2014.
(7)These PBRSUs represent the portion of the PBRSUs that were granted to the NEOs on March 3, 2014 and vest based upon our achievement of certain performance measures in 2016 and continued employment through December 31, 2016. The amount set forth in this column represents the actual number of units that are subject to distribution based on our achievements of adjusted EPS and relative Total Shareholder Return goals over a three-year performance period (2014, 2015, 2016).
(8)These RSUs represent the unvested portion of RSUs that were granted to the NEOs on March 2, 2015 which were subject to (i) the achievement of adjusted net income of $50 million for 2015 and (ii) time vesting in three equal annual installments on the first, second and third anniversaries of the grant date. We achieved the $50 million performance measure for 2015.
(9)These PBRSUs represent the portion of the PBRSUs that were granted to the NEOs on March 2, 2015 and vest based upon our achievement of certain performance measures in 2015 and continued employment through December 31, 2017. The amount set forth in this column represents the actual number of units that are subject to a one-year time vesting requirement based on our achievement of adjusted EPS in 2015 and 2016.
(10)These RSUs represent the unvested portion of RSUs that were granted to the NEOs on March 1, 2016 which were subject to (i) the achievement of adjusted net income of $55 million for 2016 and (ii) time vesting in three equal annual installments on the first, second and third anniversaries of the grant date. We achieved the $55 million performance measure for 2016.
(11)These PBRSUs represent the portion of the PBRSUs that were granted to the NEOs on March 1, 2016 and vest based upon our achievement of certain performance measures in 2016 and continued employment through December 31, 2018. The amount set forth in this column represents the actual number of units that are subject to the two-year time vesting requirement based on our achievement of adjusted EPS in 2016.
(12)These PBRSUs represent the portion of the PBRSUs that were granted to the NEOs on March 2, 2015 that remain subject to our achievement of certain performance measures. The amount set forth in this column represents the estimated future payout of PBRSUs assuming the target performance goals have been achieved. The PBRSUs vest based on the degree of achievement of certain adjusted EPS goals over a three-year performance period (2015, 2016 and 2017). See Compensation Discussion and Analysis — Long-Term Incentives above for detailed discussion.
(13)These PBRSUs represent the portion of the PBRSUs that were granted to the NEOs on March 1, 2016 that remain subject to our achievement of certain performance measures. The amount set forth in this column represents the estimated future payout of PBRSUs assuming the target performance goals have been achieved. The PBRSUs vest based on the degree of achievement of certain adjusted EPS goals over a three-year performance period (2016, 2017 and 2018). See Compensation Discussion and Analysis — Long-Term Incentives above for detailed discussion.
Table of Contents
| | | | | | | | | | | | | | | | | | | | | | | | | | | | | | | | | | | | Option Awards | | | Stock Awards | | | | | | | | | | | Name | | Number of
Securities
Underlying
Unexercised
Options
Exercisable
(#) | | | Number of
Securities
Underlying
Unexercised
Options
Unexercisable
(#) | | | Option
Exercise
Price
($) | | | Option
Expiration
Date (1) | | | Number of
Shares or
Units of
Stock That Have
Not
Vested
(#) | | | Market
Value of
Shares or
Units of
Stock That
Have Not
Vested (2)
($) | | | Equity
Incentive
Plan
Awards:
Number of
Unearned
Shares,
Units or
Other
Rights
That Have
Not Vested
(#) | | | Equity
Incentive
Plan
Awards:
Market or
Payout Value
of Unearned
Shares, Units
or Other
Rights That
Have Not
Vested
($) | | Frank D. Martell | | | | | | | | | | | | | | | | | | | | | | | | | | | | | | | | | | 116,298 | | | | | | | | 11.35 | | | | 8/29/2021 | | | | | | | | | | | | | | | | | | | | | | 63,870 | | | | | | | | 15.50 | | | | 3/1/2022 | | | | | | | | | | | | | | | | | | | | | | 38,150 | | | | | | | | 25.95 | | | | 2/26/2023 | | | | | | | | | | | | | | | | | | | | | | 20,313 | | | | | | | | 32.49 | | | | 3/2/2024 | | | | | | | | | | | | | | | | | | | | | | | | | | | | | | | | | | | | | | 10,852 | (3) | | | 362,674 | | | | | | | | | | | | | | | | | | | | | | | | | | | | | | 45,925 | (4) | | | 1,5343,814 | | | | | | | | | | | | | | | | | | | | | | | | | | | | | | 27,614 | (5) | | | 922,860 | | | | | | | | | | | | | | | | | | | | | | | | | | | | | | 43,184 | (6) | | | 1,443,209 | | | | | | | | | | | | | | | | | | | | | | | | | | | | | | 40,696 | (7) | | | 1,360,060 | | | | | | | | | | | | | | | | | | | | | | | | | | | | | | 17,580 | (8) | | | 587,524 | | | | | | | | | | | | | | | | | | | | | | | | | | | | | | | | | | | | | | 8,284 | (9) | | | 276,851 | | | | | | | | | | | | | | | | | | | | | | | | | | | | | | 28,487 | (10) | | | 952,036 | | James L. Balas | | | | | | | | | | | | | | | | | | | | | | | | | | | | | | | | | | | | | 7,732 | | | | | | | | 11.38 | | | | 9/27/2021 | | | | | | | | | | | | | | | | | | | | | | 8,709 | | | | | | | | 15.50 | | | | 3/1/2022 | | | | | | | | | | | | | | | | | | | | | | 7,803 | | | | | | | | 25.95 | | | | 2/26/2023 | | | | | | | | | | | | | | | | | | | | | | 3,693 | | | | | | | | 32.49 | | | | 3/2/2024 | | | | | | | | | | | | | | | | | | | | | | | | | | | | | | | | | | | | | | 3,043 | (3) | | | 101,697 | | | | | | | | | | | | | | | | | | | | | | | | | | | | | | 12,878 | (4) | | | 430,383 | | | | | | | | | | | | | | | | | | | | | | | | | | | | | | 7,230 | (5) | | | 241,627 | | | | | | | | | | | | | | | | | | | | | | | | | | | | | | 11,305 | (6) | | | 377,813 | | | | | | | | | | | | | | | | | | | | | | | | | | | | | | 9,885 | (7) | | | 330,357 | | | | | | | | | | | | | | | | | | | | | | | | | | | | | | 4,270 | (8) | | | 142,703 | | | | | | | | | | | | | | | | | | | | | | | | | | | | | | | | | | | | | | 2,168 | (9) | | | 72,455 | | | | | | | | | | | | | | | | | | | | | | | | | | | | | | 6,919 | (10) | | | 231,233 | | | | | | | | | | | | | | | | | | | | | | | | | | | | | | 8,884 | (11) | | | 296,903 | |
| | | | | | | | | | | | | | | | | | | | | | | | | | | | | | | | | | | | Option Awards | | | Stock Awards | | | | | | | | | | | Name | | Number of
Securities
Underlying
Unexercised
Options
Exercisable
(#) | | | Number of
Securities
Underlying
Unexercised
Options
Unexercisable
(#) | | | Option
Exercise
Price
($) | | | Option
Expiration
Date (1) | | | Number of
Shares or
Units of
Stock That Have
Not
Vested
(#) | | | Market
Value of
Shares or
Units of
Stock That
Have Not
Vested (2)
($) | | | Equity
Incentive
Plan
Awards:
Number of
Unearned
Shares,
Units or
Other
Rights
That Have
Not Vested
(#) | | | Equity
Incentive
Plan
Awards:
Market or
Payout Value
of Unearned
Shares, Units
or Other
Rights That
Have Not
Vested
($) | | Barry M. Sando | | | | | | | | | | | | | | | | | | | | | | | | | | | | | | | | | | 8,701 | | | | | | | | 17.24 | | | | 3/15/2021 | | | | | | | | | | | | | | | | | | | | | | 22,532 | | | | | | | | 15.50 | | | | 3/1/2022 | | | | | | | | | | | | | | | | | | | | | | 26,011 | | | | | | | | 25.95 | | | | 2/26/2023 | | | | | | | | | | | | | | | | | | | | | | 18,467 | | | | | | | | 32.49 | | | | 3/2/2024 | | | | | | | | | | | | | | | | | | | | | | | | | | | | | | | | | | | | | | 5,247 | (3) | | | 175,355 | | | | | | | | | | | | | | | | | | | | | | | | | | | | | | 22,205 | (4) | | | 742,091 | | | | | | | | | | | | | | | | | | | | | | | | | | | | | | 9,356 | (5) | | | 312,678 | | | | | | | | | | | | | | | | | | | | | | | | | | | | | | 14,631 | (6) | | | 488,968 | | | | | | | | | | | | | | | | | | | | | | | | | | | | | | 12,082 | (7) | | | 403,780 | | | | | | | | | | | | | | | | | | | | | | | | | | | | | | 5,219 | (8) | | | 174,419 | | | | | | | | | | | | | | | | | | | | | | | | | | | | | | | | | | | | | | 2,806 | (9) | | | 93,777 | | | | | | | | | | | | | | | | | | | | | | | | | | | | | | 8,457 | (10) | | | 282,633 | | | | | | | | | | | | | | | | | | | | | | | | | | | | | | 10,858 | (11) | | | 362,874 | | Arnold A. Pinkston | | | | | | | | | | | | | | | | | | | | | | | | | | | | | | | | | | | | | | | | | | | | | | | | | | 9,336 | (7) | | | 312,009 | | | | | | | | | | | | | | | | | | | | | | | | | | | | | | 4,033 | (8) | | | 134,783 | | | | | | | | | | | | | | | | | | | | | | | | | | | | | | | | | | | | | | 6,535 | (10) | | | 218,400 | | | | | | | | | | | | | | | | | | | | | | | | | | | | | | 8,390 | (11) | | | 280,394 | |
| (1) | The stock options disclosed in this table have aten-year term. As of December 31, 2018, all stock options were fully vested. |
| (2) | Represents the value of unvested RSUs based on closing stock price on December 31, 2018 of $33.42. |
| (3) | These RSUs represent the unvested portion of RSUs that were granted to the NEOs on March 1, 2016 which were subject to (i) the achievement of adjusted net income of $55 million for 2016 and (ii) time vesting in three equal annual installments on the first, second and third anniversaries of the grant date. We achieved the $55 million performance measure for 2016. |
| (4) | These PBRSUs represent the portion of the PBRSUs that were granted to the NEOs on March 1, 2016 and vest based upon our achievement of certain performance measures and continued employment through December 31, 2018. The amount set forth in this column represents the aggregate number of units that were distributed based on our achievements of adjusted EPS and relative TSR goals over thethree-year performance period (2016, 2017, 2018). |
| (5) | These RSUs represent the unvested portion of RSUs that were granted to the NEOs on February 28, 2017 and, for Mr. Martell, also on March 14, 2017, which were subject to (i) the achievement of adjusted net income of $57.5 million for 2017 and (ii) time vesting in three equal annual installments on the first, second and third anniversaries of the grant date. We achieved the $57.5 million performance measure for 2017. |
| (6) | These PBRSUs represent the portion of the PBRSUs that were granted to the NEOs on February 28, 2017 and, for Mr. Martell, also on March 14, 2017, and vest based upon our achievement of certain performance measures and continued employment through December 31, 2019. The amount set forth in this column represents the actual number of units that are subject to the time vesting requirement based on our achievement of adjusted EPS in 2017 and 2018. |
| (7) | These RSUs represent the unvested portion of RSUs that were granted to the NEOs on March 1, 2018, which were subject to (i) the achievement of adjusted net income of $62.5 million for 2018 and (ii) time vesting in three equal annual installments on the first, second and third anniversaries of the grant date. We achieved the $62.5 million performance measure for 2018. |
| (8) | These PBRSUs represent the portion of the PBRSUs that were granted to the NEOs on March 1, 2018, and vest based upon our achievement of certain performance measures and continued employment through December 31, 2020. The amount set forth in this column represents the actual number of units that are subject to the time vesting requirement based on our achievement of adjusted EPS in 2018. |
| (9) | These PBRSUs represent the portion of the PBRSUs that were granted to the NEOs on February 28, 2017 and, for Mr. Martell, also on March 14, 2017, that remain subject to our achievement of certain performance measures. The amount set forth in this column represents the estimated future payout of PBRSUs assuming the target performance goals have been achieved. The PBRSUs vest based on the degree of achievement of certain adjusted EPS goals over athree-year performance period (2017, 2018 and 2019). |
| (10) | These PBRSUs represent the portion of the PBRSUs that were granted to the NEOs on March 1, 2018, that remain subject to our achievement of certain performance measures. The amount set forth in this column represents the estimated future payout of PBRSUs assuming the target performance goals have been achieved. The PBRSUs vest based on the degree of achievement of certain adjusted EPS goals over athree-year performance period (2018, 2019 and 2020). See “Compensation Discussion and Analysis—Long-Term Incentives” above for detailed discussion. |
| (11) | These PBRSUs were granted as a specialone-time A30 Award to our NEOs, excluding the CEO, on September 20, 2018 and remain subject to the achievement of certain performance measures. The amount set forth in this column represents the estimated future payout of the A30 Awards assuming the target performance goal of 30% adjusted EBITDA margin has been achieved. The PBRSUs vest, if at all, based on achievement ofpre-determined 2020 adjusted EBITDA margin targets. “See Compensation Discussion and Analysis—Long-Term Incentives” above for detailed discussion of the A30 Awards. |
Option Exercises and Stock Vested for 2016
2018 The following table sets forth information concerning value realized by each of the NEOs upon exercise of stock options and vesting of other stock awards during 2016.2018. | | | | | | | | | | | | | | | | | | | | | | | | | | | | | | | Option Awards |
| Stock Awards |
| | | | Name |
| Number of
Shares Acquired
on Exercise
(#) |
| Value Realized
on Exercise
($)(1) |
| Number of
Shares Acquired
on Vesting
(#) |
| Value Realized
on Vesting
($)(2) |
| | | | | | | | | | | | | | | | | | Anand Nallathambi | | — | | — | | 38,318 | | 2,499,308 | | | | | Frank D. Martell | | — | | — | | 15,438 | | 864,338 | | | | | James Balas | | — | | — | | 2,788 | | 161,727 | | | | | Barry M. Sando | | 112,443 | | 2,144,845 | | 12,919 | | 614,696 | | | | | Stergios Theologides | | — | | — | | 6,869 | | 388,922 | | | | | | | | | | | | | | | | |
(1)Value realized on exercise is based on the fair market value of our common stock on the date of exercise minus the exercise price and does not necessarily reflect proceeds actually received by the named executive officer.
(2)Value realized on vesting is based on the fair market value of our common stock on the vesting date and does not necessarily reflect proceeds actually received by the named executive officer.
| | | | | | | | | | | | | | | | | | | | Option Awards | | | Stock Awards | | | | | | | Name | | Number of
Shares Acquired
on Exercise
(#) | | | Value Realized
on Exercise
($) (1) | | | Number of
Shares Acquired
on Vesting
(#) | | | Value Realized
on Vesting
($)(2) | | Frank D. Martell | | | — | | | | — | | | | 69,044 | | | | 3,145,328 | | James L. Balas | | | — | | | | — | | | | 13,758 | | | | 626,231 | | Barry M. Sando | | | 8,700 | | | | 285,236 | | | | 39,970 | | | | 1,819,505 | | Arnold A. Pinkston | | | — | | | | — | | | | — | | | | — | |
| (1) | Value realized on exercise is based on the fair market value of our common stock on the date of exercise minus the exercise price and does not necessarily reflect proceeds actually received by the NEO. |
| (2) | Value realized on vesting is based on the fair market value of our common stock on the vesting date and does not necessarily reflect proceeds actually received by the NEO. |
Pension Benefits for 2016
2018 The following table shows the actuarial present value of the accumulated retirement benefits payable upon normal retirement age to each of the NEOs who participate in a pension plan, computed as of December 31, 2016.2018. The amounts disclosed are based upon benefits provided to the NEOs under our Pension Restoration Plan ("Pension Restoration Plan") and our Executive Supplemental Benefit Plan. Benefit accruals were frozen under the Pension Restoration Plan as of April 30, 2008 and the Executive Supplemental Benefit Plan was frozen effective December 31, 2010. Prior to the Separation, weWe previously maintained a pension plan, which was assumed by First American Financial Corporation ("FAFC"(“FAFC”) in connection with the Separation.spinning off our financial services businesses now known as FAFC on June 1, 2010 (the “Separation”). Messrs. Balas, Martell and TheologidesPinkston were not eligible to participate in the Pension Restoration Plan or the Executive Supplemental Benefit Plan and therefore they are not included in the following table. | | | | | | | | | | | | | | | | | | | | | | | | | | | | | Name |
| Plan Name |
| Number
of Years
Credited
Service(1)
(#) |
| Present
Value of
Accumulated
Benefits(2)
($) |
| Payments
During
Last Fiscal
Year
($) |
| | | | | | | | | | | | | | | | | | Anand Nallathambi | | Executive Supplemental Benefit Plan | | 25 | | 3,999,470 | | — | | | | | Barry M. Sando | | Executive Supplemental Benefit Plan | | 25 | | 5,187,253 | | — | | | | | | | Pension Restoration Plan | | 24 | | 116,066 | | — | | | | | | | | | | | | | | | | |
(1) | | | | | | | | | | | | | | | | | | | | Name | | Plan Name | | Number
of Years
Credited
Service (1)(#) | | | Present
Value of
Accumulated
Benefits (2)($) | | | Payments
During
Last Fiscal
Year | | Barry M. Sando | | Executive Supplemental Benefit Plan | | | 27 | | | | 5,396,218 | | | | — | | Barry M. Sando | | Pension Restoration Plan | | | 26 | | | | 121,528 | | | | — | |
| (1) | Credited years of service for the Pension Restoration Plan and the Executive Supplemental Benefit Plan is the time between the participant’s deemed participation date under the plan and December 31, 2018. |
| (2) | The Pension Restoration Plan benefits generally accrue from the date of employment through the normal retirement age (as discussed below). The following assumptions were used for calculating present values: interest rate of 4.23%,post-retirement mortality perRP-2014 Table for Healthy Annuitants with mortality projection starting in 2006 using Fully Generational ScaleMP-2018, and benefit is payable as a single life annuity. |
| Executive Supplemental Benefit Plan eligibility requires 10 years of service and 5 years of participation in the plan with the benefit dependent on age at retirement between 55 and 62, rather than credited years of service. The following assumptions were used for calculating present value: interest rate of 4.15%post-retirement mortality at December 31, 2018;RP-2006 “Healthy Annuitants” table with generational projection based onMP-2018 Order 2 Graduation Alternative Projection Scale. Benefit is payable as a 50% joint and survivor annuity. |
Pension Restoration Plan and the Executive Supplemental Benefit Plan is the time between the participant's deemed participation date under the plan and December 31, 2016.
(2)The Pension Restoration Plan benefits generally accrue from the date of employment through the normal retirement age (as discussed below). The following assumptions were used for calculating present values: interest rate of 4.08%, post-retirement mortality per RP-2014 Table for Healthy Annuitants with mortality projection starting in 2006 using Fully Generational Scale MP-2015, benefit is payable as a single life annuity.
Table of Contents
Executive Supplemental Benefit Plan eligibility requires 10 years of service and 5 years of participation in the plan with the benefit dependent on age at retirement between 55 and 62, rather than credited years of service. The following assumptions were used for calculating present values: interest rate of 4.00% post-retirement mortality per RP-2014 Healthy Annuitants table without collar or amount adjustments, adjusted to remove post 2007 improvement projections, with generational projection via Scale MP-2014, modified to use a 10-year convergence period to a long-term improvement rate of 1.0% by 2017, benefit is payable as a 50% joint and survivor annuity.
Pension Restoration Plan
During 1996, we adopted the Pension Restoration Plan. This plan is an unfunded,non-qualified plan designed to make up for the benefit accruals that were limited under ourtax-qualified pension plan based on compensation in excess of the amount of compensation that may be considered under federal tax law limits for qualified plans. However, in order to limit its expense, the Pension Restoration Plan does not make up for benefit accruals on compensation exceeding $275,000. The Pension Restoration Plan also makes up for benefits that could not be paid from a qualified plan because of limitations imposed by the federal tax laws. Vesting of benefits payable to an employee under the Pension Restoration Plan generally occurs upon employment through "normal“normal retirement age." "Normal” “Normal retirement age"age” is defined as the later of the employee'semployee’s attainment of age 65 or three years of service with us. The Pension Restoration Plan was effective as of January 1, 1994, but only covers selected employees who were participants in thetax-qualified pension plan formerly sponsored by us which was assumed by FAFC in connection with the Separation. The Pension Restoration Plan excludes pay earned after December 31, 2001. The Pension Restoration Plan was amended in February 2008 to eliminate benefit accruals for service after April 30, 2008. Effective January 1, 2009, to comply with Section 409A of the Code, payment of benefits under the Pension Restoration Plan commences the first of the month following a participant'sparticipant’s separation from service or six months following a participant'sparticipant’s separation from service if he is considered a specified employee. Also, benefit options under the Pension Restoration Plan include various actuarial equivalent annuity options. A participant with at least three years of service with us may elect to retire after attaining age 55, but prior to age 65, and receive reduced benefits. Benefits are reduced 1/180th for each of the first 60 months and by 1/360th for each of any additional months by which the benefit commencement date precedes the participant'sparticipant’s normal retirement date. Mr. Sando is the only NEO who participates in the Pension Restoration Plan, and he was eligible for early retirement but not normal retirement at December 31, 2016.2018. On June 1, 2010, in connection with spinning off the businesses now known as FAFC, the sponsorship of a portion of the Pension Restoration Plan and the liabilities under the plan were transferred to FAFC with respect to the accrued benefits for employees and former employees who were transferred to FAFC. We remain responsible for liabilities under the Pension Restoration Plan relating to the accrued benefits of employees who were not transferred to FAFC, which are now payable pursuant to the terms of the CoreLogic, Inc. Pension Restoration Plan, the successor plan to the original Pension Restoration Plan. The new plan is intended to govern the benefits payable to participants under the plan as of June 1, 2010 and is not intended to grant additional benefits to the participants in excess of their benefits accrued under the original Pension Restoration Plan. Executive Supplemental Benefit Plan The Executive Supplemental Benefit Plan provides retirement benefits for, andpre-retirement death benefits with respect to, certain key management personnel. The plan was originally adopted in 1985 and has been amended a number of times since then. Under the plan, as originally adopted, upon retirement at normal retirement date (the later of age 65 or completion of 10 years of service) the participant received a joint life and 50% survivor annuity benefit equal to 35% of "final“final average compensation." "Final” “Final average compensation"compensation” was determined for those three calendar years out of the last 10 years of employment preceding retirement in which final average compensation is the highest. Final average compensation
Table of Contents
includes base salary and commissions, cash bonuses and stock bonuses that are granted to compensate for past services (such as annual incentive bonus RSUs). Under the original plan, the benefit was reduced by 5% for each year prior to normal retirement date in which retirement occurs and, until age 70, increased by 5% (compounded in order to approximate the annuitized value of the benefit had retirement occurred at age 65) for each year after such date in which retirement occurs. With respect to such postponed retirement, the plan took into account covered compensation received until age 70, so that the retirement benefit of an executive who retires after normal retirement date is determined as the greater of the annuitized benefit or the benefit calculated using final average compensation until age 70. To be eligible to receive benefits under the plan, a participant must be at least age 55, have been an employee of us or one of our subsidiaries for at least 10 years and covered by the plan for at least five years. Apre-retirement death benefit is provided consisting of 10 annual payments, each of which equals 50% of final average compensation. Subject to applicable legal rules, the Board can, in its discretion, pay the participant or beneficiary in an actuarial equivalent lump sum or other form of benefit. In the event of a "change“change in control"control” (as defined in the plan) of us, a participant who retires after the change in control shall receive the same benefits as if he were retiring upon the attainment of normal retirement date. The Executive Supplemental Benefit Plan was amended in September 2005 to provide that participants who thereafter engage in competition with us, either during their employment with or following their departure, forfeit their right to receive any vested benefits under the plan. Competition includes the misappropriation, sale, use or disclosure of our trade secrets, confidential or proprietary information and solicitation of our customers. To reduce the costs of the plan to us, the plan was further amended in October 2007. Among other changes, this amendment (i) reduced the normal retirement date to the latest of age 62, the date on which the participant completes 10 years of service with us and the date on which the participant was covered, in combination, by the plan or FAC Management Supplemental Benefit Plan for five years; (ii) changed the period over which "final“final average compensation"compensation” is determined to the five calendar years preceding retirement; (iii) reduced the maximum benefit payable to a joint life and 50% survivor annuity benefit equal to 30% of final average compensation; (iv) eliminated any increased benefit for postponed retirement beyond the normal retirement date; and (v) provided for accelerated vesting only upon a change in control that is not approved by our incumbent Board. The benefit is reduced by 5.952% for each year prior to age 62 in which retirement actually occurs. Participants who were vested as of the effective date of the amendment, November 1, 2007, are entitled to receive the higher of the benefit as calculated under the amended plan and the benefit to which the participant would have been entitled had he retired on October 31, 2007. In connection with the Separation, we transferred sponsorship and administration of a portion of the Executive Supplemental Benefit Plan to FAFC. As part of this transfer, FAFC assumed the liabilities under the portion of the plan covering employees and former employees who were transferred to FAFC. Following the Separation, we remained responsible for the liabilities under the portion of the Executive Supplemental Benefit Plan relating to our employees and former employees who were not transferred to FAFC. We maintain the CoreLogic, Inc. Executive Supplemental Benefit Plan as the successor to the original Executive Supplemental Benefit Plan in satisfaction of its liabilities to such employees who were participants and accrued benefits under the Executive Supplemental Benefit Plan, but were not transferred to FAFC. The CoreLogic, Inc. Executive Supplemental Benefit Plan is intended to provide future benefits for our employees on and after June 1, 2010 and is intended to govern the benefits payable to such employees both before and after June 1, 2010.
Table of Contents
Effective December 31, 2010, the CoreLogic, Inc. Executive Supplemental Benefit Plan was frozen and amended to, among other things: (i) close the Planplan to new participants; (ii) freeze the average pay calculation as of December 31, 2010 (compensation after December 31, 2010 will not be taken into consideration in calculating benefits); (iii) amend the amount and form of thepre-retirement death benefit to provide for payment to a participant'sparticipant’s designated beneficiary in an amount equal to the survivor portion of a 50% joint and survivor annuity for the life of the beneficiary, or if the participant'sparticipant’s beneficiary is someone other than the participant'sparticipant’s spouse or domestic partner, for a maximum of twenty years; and (iv) apply a proration factor to the benefit amount payable, the numerator of which is a participant'sparticipant’s service at December 31, 2010 and the denominator of which is the participant'sparticipant’s service that would have accrued as of his or her early retirement date if the participant was not early retirement eligible as of December 31, 2010. In addition to the amendments described above, the change of control provisions were amended to provide that participants will become 100% vested in all plan benefits upon an involuntary separation from service without good cause following a change of control. Prior to the amendment, participants became 100% vested in all plan benefits upon a change of control, regardless of whether they incurred a separation of service for any reason. Furthermore, the retirement income benefit provided to participants and commencing upon a separation from service following a change of control on the same basis as though they had attained normal retirement age is limited to participants who experience an involuntary separation from service without good cause following a change of control. As of December 31, 2016,2018, there remained fivethree active employees, including Messrs. Nallathambi andMr. Sando, who participate in the plan. The plan is closed to new participants. As of December 31, 2016, Messrs. Nallathambi and2018, Mr. Sando werewas eligible for early retirement but not normal retirement. The plan is unfunded and unsecured. We have previously purchased insurance, of which we are the owner and beneficiary, on the lives of certain plan participants. This insurance is designed to offset, over the life of the plan, a portion of our costs incurred with respect to the plan. Nonqualified Deferred Compensation for 2018 Nonqualified Deferred Compensation for 2016
|
As reflected in the following table, certain of our executive officersNEOs have elected to participate in our Deferred Compensation Plan (the "Deferred Compensation Plan"). | | | | | | | | | | | | | | | | | | | | | | | | | | | | | | | | | Name |
| Executive
Contributions
in Last FY(1)
($) |
| Registrant
Contributions
in Last FY(1)
($) |
| Aggregate
Earnings in
Last FY(2)
($) |
| Aggregate
Withdrawals/
Distributions
($) |
| Aggregate
Balance at
Last FYE(3)
($) |
| | | | | | | | | | | | | | | | | | | | Anand Nallathambi | | 80,000 | | 60,372 | | 154,796 | | — | | 1,877,717 | | | | | Frank D. Martell | | 420,140 | | 47,562 | | 96,169 | | — | | 1,117,743 | | | | | James Balas | | 105,000 | | 14,446 | | 24,278 | | | | 264,701 | | | | | Barry M. Sando | | 38,400 | | 30,450 | | 70,219 | | — | | 931,630 | | | | | Stergios Theologides | | 62,990 | | 104,872 | | 74,049 | | 46,225 | | 861,541 | | | | | | | | | | | | | | | | | | |
(1)All contributions presented are reported in the 2016 Summary Compensation Table under "Salary," "Non-Equity Incentive Plan Compensation" or "All Other Compensation" for 2016.
(2)Represents earnings or losses on participant-selected investment options. None of the amounts are reflected in the 2016 Summary Compensation Table because the return on deferred amounts is calculated in a similar manner and at a similar rate as earnings on externally managed mutual funds.
(3)To the extent the executive officers were NEOs in prior years, the amounts reported in the aggregate balance at last fiscal year end that represented prior salary and non-equity incentive plan compensation deferrals or Company contributions were previously reported as compensation to the NEO in our Summary Compensation Table as "Salary," "Non-Equity Incentive Plan Compensation" or "All Other Compensation" in previous years. Amounts reported in the aggregate balance at last fiscal year end that represent earnings in prior years on previously deferred amounts are not reflected on prior period Summary Compensation Tables.
Plan. Table of Contents
| | | | | | | | | | | | | | | | | | | | | | Name | | Executive
Contributions
in Last FY (1)($) | | | Registrant
Contributions
in Last FY (1)($) | | | Aggregate
Earnings
in Last FY (2)($) | | | Aggregate
Balance at
Last FYE
(3)($) | | Frank D. Martell | | | 312,500 | | | | 47,099 | | | | (141,084 | ) | | | 2,037,968 | | James L. Balas | | | 183,750 | | | | 20,591 | | | | (54,696 | ) | | | 663,865 | | Barry M. Sando | | | 20,700 | | | | 30,600 | | | | (81,033 | ) | | | 1,137,030 | |
| (1) | All contributions presented herein reflect amounts actually deferred in 2018, while amounts reported in the 2018 Summary Compensation Table under “All Other Compensation” reflect amounts earned for 2018. |
| (2) | Represents earnings or losses onparticipant-selected investment options. None of the amounts are reflected in the 2018 Summary Compensation Table because the return on deferred amounts is calculated in a similar manner and at a similar rate as earnings on externally managed mutual funds. |
| (3) | To the extent the executive officers were NEOs in prior years, the amounts reported in the aggregate balance at last fiscal year end that represented prior salary andnon-equity incentive plan compensation deferrals or Company contributions were previously reported as compensation to the NEO in our Summary Compensation Table as “Salary,”“Non-Equity Incentive Plan Compensation” or “All Other Compensation” in previous years. Amounts reported in the aggregate balance at last fiscal year end that represent earnings in prior years on previously deferred amounts are not reflected on prior period Summary Compensation Tables. |
The Deferred Compensation Plan offers to a select group of management and highly compensated employees the opportunity to elect to defer portions of their base salary, commissions and cash bonuses. We maintain a deferral account for each participating employee on a fully vested basis for all employee deferrals. Participants can choose to have their cash benefits paid in one lump sum or in quarterly payments upon separation from service or death. Subject to the terms and conditions of the plan, participants may also elect scheduled and nonscheduledin-service withdrawals of compensation deferred prior to January 1, 2005, and the earnings and losses attributable thereto. Withdrawals of compensation deferred after December 31, 2004, and the earnings and losses attributable thereto, must be scheduled by the participant at the time the participant elects to defer such compensation. Participants allocate their deferrals among a variety of investment crediting options offered under the plan. The investment crediting rates are based upon the rates of return available under certain separate accounts offered through variable insurance products. For all participants who joined the Deferred Compensation Plan prior to December 31, 2001, the plan provides apre-retirement life insurance benefit equal to the lesser of 15 times the amount deferred in the participant'sparticipant’s first year of participation or $2 million. The life insurance benefit is reduced beginning at age 61 by 20% per year. Participants who join the plan after December 31, 2001 are not eligible for this insurance benefit. We pay a portion of the cost of such life insurance benefits. The plan is unfunded and unsecured. The Deferred Compensation Plan was amended in 2010 to provide for (i) Company contributions to the plan in the form of 401(k) restoration contributions and (ii) Company discretionary retirement savings contributions to a limited number of senior officers who were not eligible to participate in the Executive Supplemental Benefit Plan.contributions. The amount of our 401(k) restorations contributions made to participant accounts is determined based on the amount of discretionary matching contributions that would be made under the 401(k) Plan if the participants'participants’ deferrals under the Deferred Compensation Plan were instead made under the 401(k) Plan, but without regard to the statutory limits that apply to the benefits that may be provided under the 401(k) Plan. The discretionary retirement savings contribution for Mr. Theologides vests five years following contribution. There are currently no other vesting limitations in the Deferred Compensation Plan. Potential Payments Upon Termination or Change in Control Potential Payments Upon Termination or Change in Control
|
The following tables describe payments and other benefits that would be provided to certain of our executive officersNEOs under the specified circumstances upon a change in control of us or their termination,
Table of Contents
assuming a termination or change in control occurred on December 31, 2016.2018. For further discussion, see “Compensation Discussion and Analysis — Analysis—Change in Control Agreements” above. | | | | | | | | | | | | | | | | | | | | | | | | | | | | | | | | | | | | | | | | | | | | | Name | | Trigger | | Severance | | | Bonus | | | Value of RSU
Acceleration (6) | | | Value of
PBRSU
Acceleration (7) | | | Deferred
Compensation (8) | | | Vested
Pension
Plan (11) | | | Benefit
Continuation | | | Total | | Frank Martell | | Voluntary Resignation | | | — | | | | — | | | | — | | | | — | | | | 2,037,968 | | | | — | | | | — | | | | 2,037,968 | | | | Termination For Cause | | | — | | | | — | | | | — | | | | — | | | | 2,037,968 | | | | — | | | | — | | | | 2,037,968 | | | | Termination Without Cause / For Good Reason | | | 3,744,000 | (2) | | | 1,092,000 | (4) | | | 2,645,594 | | | | — | | | | 2,037,968 | | | | — | | | | 49,542 | (9) | | | 9,569,104 | | | | Change in Control with Termination Good Reason / Without Cause (1) | | | 5,616,000 | (3) | | | 1,092,000 | (5) | | | 2,645,594 | | | | 4,279,164 | | | | 2,037,968 | | | | — | | | | 57,162 | (10) | | | 15,727,888 | | | | Death | | | — | | | | 1,092,000 | | | | 2,645,594 | | | | 4,279,164 | | | | 2,037,968 | | | | — | | | | — | | | | 10,054,726 | | | | | Disability | | | — | | | | 1,092,000 | | | | 2,645,594 | | | | 4,279,164 | | | | 2,037,968 | | | | — | | | | — | | | | 10,054,726 | | | | | | | | | | | | | | | | | | | | | | | | | | | | | | | | | | | | | James Balas | | Voluntary Resignation | | | — | | | | — | | | | — | | | | — | | | | 663,865 | | | | — | | | | — | | | | 663,865 | | | | Termination For Cause | | | | | | | — | | | | — | | | | — | | | | 663,865 | | | | — | | | | — | | | | 663,865 | | | | Termination Without Cause | | | 900,000 | (2) | | | 450,000 | (4) | | | 673,680 | | | | — | | | | 663,865 | | | | — | | | | 24,370 | (9) | | | 2,711,915 | | | | Change in Control with Termination Good Reason / Without Cause (1) | | | 1,800,000 | (3) | | | 450,000 | (5) | | | 673,680 | | | | 1,420,049 | | | | 663,865 | | | | — | | | | 39,308 | (10) | | | 5,046,903 | | | | Death | | | — | | | | 450,000 | | | | 673,680 | | | | 1,420,049 | | | | 663,865 | | | | — | | | | — | | | | 3,207,595 | | | | Disability | | | — | | | | 450,000 | | | | 673,680 | | | | 1,420,049 | | | | 663,865 | | | | — | | | | — | | | | 3,207,595 | | | | | | | | | | | | | | | | | | | | | | | | | | | | | | | | | | | | | | Barry M. Sando | | Voluntary Resignation | | | — | | | | — | | | | — | | | | — | | | | 1,137,030 | | | | 5,372,831 | (12) | | | — | | | | 6,509,861 | | | | Termination For Cause | | | — | | | | — | | | | — | | | | — | | | | 1,137,030 | | | | 5,372,831 | (12) | | | — | | | | 6,509,861 | | | | Termination Without Cause | | | 2,200,000 | (2) | | | 522,500 | (4) | | | 608,979 | | | | — | | | | 1,137,030 | | | | 5,372,831 | (12) | | | 33,440 | (9) | | | 9,874,780 | | | | Change in Control with Termination Good Reason / Without Cause (1) | | | 3,300,000 | (3) | | | 522,500 | (5) | | | 608,979 | | | | 1,159,340 | | | | 1,137,030 | | | | 6,516,590 | (12)(13) | | | 39,986 | (10) | | | 13,284,425 | | | | Death | | | — | | | | 522,500 | | | | 608,979 | | | | 1,159,340 | | | | 1,137,030 | | | | 2,766,213 | (12)(14) | | | — | | | | 6,194,062 | | | | | Disability | | | — | | | | 522,500 | | | | 608,979 | | | | 1,159,340 | | | | 1,137,030 | | | | 5,372,831 | (12) | | | — | | | | 8,800,680 | | | | | | | | | | | | | | | | | | | | | | | | | | | | | | | | | | | | | Arnold A. Pinkston | | Voluntary Resignation | | | — | | | | — | | | | — | | | | — | | | | — | | | | — | | | | — | | | | 0 | | | | Termination For Cause | | | — | | | | — | | | | — | | | | — | | | | — | | | | — | | | | — | | | | 0 | | | | Termination Without Cause | | | 765,000 | (2) | | | 340,000 | (4) | | | 312,009 | | | | — | | | | — | | | | — | | | | 24,771 | (9) | | | 1,441,780 | | | | Change in Control with Termination Good Reason / Without Cause (1) | | | 1,530,000 | (3) | | | 340,000 | (5) | | | 312,009 | | | | 592,403 | | | | — | | | | — | | | | 39,308 | (10) | | | 2,813,720 | | | | Death | | | — | | | | 340,000 | | | | 312,009 | | | | 592,403 | | | | — | | | | — | | | | — | | | | 1,244,412 | | | | | Disability | | | — | | | | 340,000 | | | | 312,009 | | | | 592,403 | | | | — | | | | — | | | | — | | | | 1,244,412 | |
| | | | | | | | | | | | | | | | | | | | | | | | | | |
| |
| |
| |
| |
| |
| |
| |
| |
|
|---|
| | | | | | | | | | | | | | | | | | | | | Anand Nallathambi |
| | | | | | | | | | | | | | | | | | | | | | | Potential Payments upon Termination or Change in Control
|
| | | | | | | | | | | | | | | | | | | | | | | | | | | | | Involuntary Termination | | Change in Control (1) | | | | | | | | | | | | | | | | | | | | | | | | | | | | Executive Payments and Benefits
Upon Termination | | Voluntary
Resignation
($) | | For Cause
($) | |
Without
Cause/
for Good
Reason
($) | | With Termination
for Good Reason/
Without Cause
($) | | Death
($) (2) | | Disability
($) | | | | | | | | | | | | | | | | | | | | | | | | Compensation | | | | | | | | | | | | | | | | | | | | | | Severance | | | — | | | — | | 3,600,000 | (3) | | 5,400,000 | (4) | | — | | — | | | | | | Bonus | | | — | | | — | | 1,390,030 | (5) | | 1,000,000 | (6) | | 1,000,000 | | 1,000,000 | | | | | | Accelerated Vesting — Options (7) | | | — | | | — | | — | | | 98,848 | | | 98,848 | | 98,848 | | | | | | Accelerated Vesting — RSU (8) | | | 419,420 | | | — | | 4,028,649 | | | 4,028,649 | | | 4,028,649 | | 4,028,649 | | | | | | Accelerated Vesting — PBRSU (9) | | | — | | | — | | — | | | 4,285,981 | | | 4,285,981 | | 4,285,981 | | | | | | Deferred Compensation Plan (10) | | | 1,877,717 | | | 1,877,717 | | 1,877,717 | | | 1,877,717 | | | 1,877,717 | | 1,877,717 | | | | | | Executive Supplemental Benefit Plan (11) | | | 3,398,966 | | | 3,398,966 | | 3,398,966 | | | 5,826,532 | (12) | | 2,038,826 | (13) | 3,398,966 | (14) | | | | | Benefit Continuation | | | — | | | — | | 43,484 | (15) | | 50,786 | (16) | | — | | — | | | | | | Total | | | 5,696,103 | | | 5,276,683 | | 14,338,846 | | | 22,568,513 | | | 13,330,021 | | 14,690,161 | | | | | | | | | | | | | | | | | | | | |
(1)In accordance with SEC rules, an excise calculation is not presented in this table as we do not provide a gross-up or tax reimbursement to our NEOs in connection with a change in control. Amounts payable to Mr. Nallathambi in the event of a change in control may be subject to reduction under Sections 280G and 4999 of the Code.
(2)On March 2, 2017, Mr. Nallathambi passed away while on a medical leave of absence.
(3)Represents an amount equal to two times the sum of (i) Mr. Nallathambi's annualized base salary in effect on the date his employment terminates (the "Severance Date") plus (ii) the target annual Incentive Bonus amount for Mr. Nallathambi in effect on the Severance Date (the "Severance Benefit"). The Severance Benefit will be payable in a lump sum equal to 7/24 of the Severance Benefit on the seventh month after the Severance Date with an additional 1/24 of the Severance Benefit paid each month until the month which is 24 months after the Severance Date. Receipt of the benefit is contingent upon execution of a general release of claims and compliance with certain post-termination covenants and confidentiality provisions in the employment agreement.
(4)Represents three times Mr. Nallathambi's base salary in effect immediately prior to the date of termination by us and three times Mr. Nallathambi's target annual cash bonus established for fiscal year 2016. Receipt of the benefit is contingent upon execution of a general release of claims.
(5)Represents the pro rata portion of Mr. Nallathambi's annual cash bonus for fiscal year 2016. Mr. Nallathambi's agreement provides for the payment of the pro rata portion of the bonus amount he would have received had his employment not terminated during the fiscal year. Such payment is required to be paid within two and one-half months following fiscal year end, and is contingent upon execution of a general release of claims and compliance with certain post-termination covenants and confidentiality provisions in the employment agreement.
(6)Represents the pro rata portion of Mr. Nallathambi's target annual cash bonus for the year of termination. Mr. Nallathambi's agreement provides for the payment of the target annual cash bonus established for fiscal year 2016. Receipt of the benefit is contingent upon execution of a general release of claims.
(7)Outstanding unvested stock options will generally accelerate on death, disability or involuntary termination without cause in connection with a change in control. Mr. Nallathambi held a total of 22,776 unvested stock options with exercise prices less than $36.83, the closing stock price on December 31, 2016, and the amount shown represents the difference between $36.83 and the exercise prices for the unvested options, multiplied by the applicable number of unvested options.
(8)Represents the value after acceleration of outstanding unvested RSUs based on our closing stock price on December 31, 2016 of $36.83. The outstanding unvested RSUs reported above will accelerate and vest on an involuntary termination without cause (whether before or after a change in control, although not all outstanding RSUs may vest on such a termination before a change in control), retirement, death or disability. For certain terminations of employment, the accelerated vesting is subject to a requirement that Mr. Nallathambi signs a general release of claims and complies with certain post-termination covenants and confidentiality provisions in the employment agreement.
| (1) | In accordance with SEC rules, an excise tax calculation is not presented in this table as we do not provide agross-up or tax reimbursement to our NEOs in connection with a change in control. Amounts payable in the event of a change in control may be subject to reduction under Sections 280G and 4999 of the Code. |
Table of Contents
(9)Represents the value after acceleration of all outstanding unvested PBRSUs based on our closing stock price on December 31, 2016 of $36.83. All or a pro-rata portion of outstanding unvested PBRSUs will generally accelerate on death, disability or involuntary termination without cause following a change in control, subject to attainment of the performance measures for any termination prior to a change in control. We have assumed that the target number of PBRSUs would become vested in connection with each acceleration event, although the actual number of PBRSUs that could become vested could be higher or lower than the target number of PBRSUs, based on actual performance.
(10)Refers to payments accrued under the Deferred Compensation Plan as of December 31, 2016 based on Mr. Nallathambi's salary deferral election and 401(k) restoration contributions.
(11)"Enhanced Executive Supplemental Benefit Plan" refers to any payments which accrued to the participant in addition to his current vested benefit amount under the various scenarios for the Executive Supplemental Benefit Plan.
(12)Represents the enhanced present value of the benefit calculated using the following assumptions: interest rate of 4.00% post-retirement mortality per RP-2014 Healthy Annuitants table without collar or amount adjustments, adjusted to remove post 2007 improvement projections, with generational projection via Scale MP-2014, modified to use a 10-year convergence period to a long-term improvement rate of 1.0% by 2017. Upon an involuntary termination without cause after a change in control of us, Mr. Nallathambi becomes 100% vested in the benefit in the amount Mr. Nallathambi| (2) | Represents an amount equal to a multiple of annualized base salary in effect on the date employment terminates (the “Severance Date”) — two times annualized base salary in the case of Messrs. Martell and Sando;one-time annualized base salary in the case of Messrs. Balas and Pinkston, plus (ii) the same multiple of target annual ICP amount in effect on the Severance Date (the “Severance Benefit”). The Severance Benefit will be payable in a lump sum equal to7/24 (7/12 for Messrs. Balas and Pinkston) of the Severance Benefit on the seventh month after the Severance Date with an additional1/24(1/12 for Messrs. Balas and Pinkston) of the Severance Benefit paid each month until the month which is 24 months for Messrs. Martell and Sando (12 months for Messrs. Balas and Pinkston) after the Severance Date. Receipt of the benefit is contingent upon execution of a general release of claims and compliance with certainpost-termination covenants, including a 24 monthpost-terminationnon-competition covenant for Messrs. Martell and Sando (12 months for Messrs. Balas and Pinkston), and confidentiality provisions in the employment agreement. |
| (3) | Represents a multiple of base salary in effect immediately prior to the date of termination by us (three times base salary for Messrs. Martell and Sando and two times base salary for Messrs. Balas and Pinkston) and a multiple of target annual cash bonus established for fiscal year (three times for Messrs. Martell and Sando; two times for Messrs. Balas and Pinkston). Receipt of the benefit is contingent upon execution of a general release of claims. |
| (4) | Represents the pro rata portion of annual cash bonus for fiscal year 2018; applicable agreements provide for the payment of the pro rata portion of the bonus amount that would have been paid if employment had not terminated during the fiscal year. Such payment is required to be paid within two and one half months following fiscal year end. Receipt of the benefit is contingent upon execution of a general release of claims and compliance with certain post termination covenants, including a 24 month post-terminationnon-competition covenant, and confidentiality provisions in the employment agreement for Messrs. Martell and Sando (12 months for Messrs. Balas and Pinkston). |
| (5) | Represents the pro rata portion of target annual cash bonus for the year of termination; applicable agreements provide for the payment of the target annual cash bonus established for fiscal year 2018. Receipt of the benefit is contingent upon execution of a general release of claims. |
| (6) | Represents the value after acceleration of outstanding unvested RSUs based on our closing stock price on December 31, 2018 of $33.42. The outstanding unvested RSUs reported above will accelerate and vest on an involuntary termination without cause (whether before or after a change in control, although not all outstanding RSUs may vest on such a termination before a change in control), retirement, death or disability. For certain terminations of employment, the accelerated vesting is subject to execution of a general release of claims and complies with certainpost-termination covenants, including a 24 monthpost-terminationnon-competition covenant, and confidentiality provisions in the employment agreement for Messrs. Martell and Sando (12 months for Messrs. Balas and Pinkston). |
| (7) | Represents the value after acceleration of all outstanding unvested PBRSUs based on our closing stock price on December 31, 2018 of $33.42. All or apro-rata portion of outstanding unvested PBRSUs will generally accelerate on death, disability or involuntary termination without cause following a change in control, subject to attainment of the performance measures for any termination prior to a change in control. We have assumed that the target number of PBRSUs would become vested in connection with each acceleration event, although the actual number of PBRSUs that could become vested could be higher or lower than the target number of PBRSUs, based on actual performance. |
| (8) | Refers to payments accrued under the Deferred Compensation Plan as of December 31, 2018 based on each executive officer’s salary deferral election and 401(k) restoration contributions. |
| (9) | Represents the cost of continued health and welfare benefits for 24 months in the case of Messrs. Martell and Sando, or 12 months in the case of Messrs. Balas and Pinkston, after the date on which the termination occurs. These obligations are reduced by any welfare benefits made available to the executive officer from subsequent employers. |
| (10) | Represents the cost of continued health and welfare benefits for 36 months in the case of Messrs. Martell and Sando, or 24 months in the case of Messrs. Balas and Pinkston, after the date on which the termination occurs subject to the executive’s continued payment of the same premium payment amount as immediately prior to termination. These obligations are reduced by any welfare benefits made available to the executive officer from subsequent employers. |
| (11) | Mr. Sando is eligible to receive current vested benefits amount under the Pension Restoration Plan and Executive Supplemental Benefit Plan. |
| (12) | Represents the present value of the benefit calculated under the Executive Supplemental Benefit using the following assumptions: interest rate at 4.15%, post-retirement mortality perPR-2006 Healthy Annuitants table with generational projection based onMP-2018 Order 2 Graduation Alternative Projection Scale and the present value of the benefit calculated under the Pension Restoration Plan using the following assumptions: interest rate of 4.23%, post-retirement mortality perRP-2014 Table for Healthy Annuitants with mortality projection starting in 2006 using the Fully Generational ScaleMP-2018. |
| (13) | Upon an involuntary termination without cause after a change in control, Mr. Sando becomes 100% vested in the Executive Supplemental Benefit Plan in the amount Mr. Sando would have been entitled to receive in accordance with the provisions of the plans in effect on the date of the change of control. |
| (14) | Representspre-retirement death benefit payable to the executive officer’s spouse. |
PAY RATIO DISCLOSURE Under Section 953(b) of theDodd-Frank Wall Street Reform and Consumer Protection Act and Item 402(u) ofRegulation S-K, the Company is required to provide the ratio of the annual total compensation of Mr. Martell to the annual total compensation of the median employee of the Company. The Company believes that there have been no changes to our employee population or compensation arrangements that would result in a significant change to our pay ratio disclosure. Therefore, as permitted by RegulationS-K, we are using the same median employee as that was identified on December 31, 2017. The median employee was anon-exempt,full-time employee located in the U.S. with an annual total compensation of $67,208 for 2018, calculated in accordance with the provisionsrequirements of Item 402(c)(2)(x) ofRegulation S-K, which includes base pay, overtime pay and the Company’s matching contribution to that employee’s 401(k) plan. For the year ended December 31, 2018, the total compensation for our Chief Executive Officer, Mr. Martell, was $5,641,654 as reported in the “Total” column of the plan in effect2018 Summary Compensation Table. Based on this information, for 2018, the dateratio of the changecompensation of control.
(13)Represents pre-retirement death benefit in the form of a single life annuity payableChief Executive Officer to the executive's spouse or domestic partner, calculated as whatmedian annual total compensation of all other employees was estimated to be 83.9 to 1.We believe that our pay ratio disclosure presented above is a reasonable estimate. Because the executive would have received had he incurred a termination of employment on his normal retirement dateSEC rules for identifying the median employee and then died immediately thereafter.
(14)Representscalculating the present value of the benefit calculated using the following assumptions: interest rate of 4.00% post-retirement mortality per RP-2014 Healthy Annuitants table without collar or amount adjustments, adjusted to remove post 2007 improvement projections, with generational projection via Scale MP-2014, modifiedpay ratio allow companies to use a 10-year convergence period to a long-term improvement rate of 1.0% by 2017 deferreddifferent methodologies, exemptions, estimates and assumptions, our pay ratio disclosure may not be comparable to the earliest retirement age.
(15)Represents the cost of COBRA coverage for 24 months after the date on which the termination occurs at the cost applicable to active employees (subject to earlier termination if Mr. Nallathambi becomes eligible for comparable coverage under another employer's plan and certain alternative payments if COBRA coverage cannot be provided under our plans in effect on the date of termination).
(16)Represents the cost of continued health and welfare benefits for 36 months after the date on which the termination occurs subject to the executive's continued payment of the same premium payment amount as immediately prior to termination. These obligations are reducedpay ratio reported by any welfare benefits made available to the executive officer from subsequent employers. | | | | | | | | | | | | | | | | | | | | | | | | | | |
| |
| |
| |
| |
| |
| |
| |
| |
|
|---|
| | | | | | | | | | | | | | | | | | | | | Frank D. Martell |
| | | | | | | | | | | | | | | | | | | | | | | Potential Payments upon Termination or Change in Control
|
| | | | | | | | | | | | | | | | | | | | | | | | | | | | | Involuntary Termination | | Change in Control (1) | | | | | | | | | | | | | | | | | | | | | | | | | | | | Executive Payments and Benefits
Upon Termination | | Voluntary
Resignation
($) | | For Cause
($) | | Without
Cause
($) | |
With Termination
for Good Reason/
Without Cause
($) | | Death
($) | | Disability
($) | | | | | | | | | | | | | | | | | | | | | | | | Compensation | | | | | | | | | | | | | | | | | | | | | | Severance | | | — | | | — | | 2,925,000 | (2) | | 2,925,000 | (3) | | — | | — | | | | | | Bonus | | | — | | | — | | 1,129,400 | (4) | | 812,500 | (5) | | 812,500 | | 812,500 | | | | | | Accelerated Vesting — Options (6) | | | — | | | — | | — | | | 29,386 | | | 29,386 | | 29,386 | | | | | | Accelerated Vesting — RSU (7) | | | — | | | — | | 1,918,143 | | | 1,918,143 | | | 1,918,143 | | 1,918,143 | | | | | | Accelerated Vesting — PBRSU (8) | | | — | | | — | | — | | | 2,090,655 | | | 2,090,655 | | 2,090,655 | | | | | | Deferred Compensation (9) | | | 1,117,743 | | | 1,117,743 | | 1,117,743 | | | 1,117,743 | | | 1,117,743 | | 1,117,743 | | | | | | Benefit Continuation | | | — | | | — | | 43,484 | (10) | | 33,858 | (11) | | — | | — | | | | | | Total | | | 1,117,743 | | | 1,117,743 | | 7,133,770 | | | 8,927,285 | | | 5,968,427 | | 5,968,427 | | | | | | | | | | | | | | | | | | | | |
(1)In accordance with SEC rules, an excise calculation is not presented in this table as we do not provide a gross-up or tax reimbursement to our NEOs in connection with a change in control. Amounts payable to Mr. Martell in the event of a change in control may be subject to reduction under Sections 280G and 4999 of the Code.
(2)Represents an amount equal to two times the sum of (i) Mr. Martell's annualized base salary in effect on the date his employment terminates (the "Severance Date") plus (ii) the target annual Incentive Bonus amount for Mr. Martell in effect on the Severance Date (the "Severance Benefit"). The Severance Benefit will be payable in a lump sum equal to 7/24 of the
Table of Contents
Severance Benefit on the seventh month after the Severance Date with an additional 1/24 of the Severance Benefit paid each month until the month which is 24 months after the Severance Date. Receipt of the benefit is contingent upon execution of a general release of claims and compliance with certain post-termination covenants and confidentiality provisions in the employment agreement.
(3)Represents two times Mr. Martell's base salary in effect immediately prior to the date of termination by us and two times Mr. Martell's target annual cash bonus established for fiscal year 2016. Receipt of the benefit is contingent upon execution of a general release of claims.
(4)Represents the pro rata portion of Mr. Martell's annual cash bonus for fiscal year 2016. Mr. Martell's agreement provides for the payment of the pro rata portion of the bonus amount he would have received had his employment not terminated during the fiscal year. Such payment is required to be paid within two and one-half months following fiscal year end. Receipt of the benefit is contingent upon execution of a general release of claims and compliance with certain post-termination covenants and confidentiality provisions in the employment agreement.
(5)Represents the pro rata portion of Mr. Martell's target annual cash bonus for the year of termination. Mr. Martell's agreement provides for the payment of the target annual cash bonus established for fiscal year 2016. Receipt of the benefit is contingent upon execution of a general release of claims.
(6)Outstanding unvested stock options will generally accelerate on death, disability or involuntary termination without cause in connection with a change in control. Mr. Martell held a total of 6,771 unvested stock options with exercise prices less than $36.83, the closing stock price on December 31, 2016, and the amount shown represents the difference between $36.83 and the exercise prices for the unvested options, multiplied by the applicable number of unvested options.
(7)Represents the value after acceleration of outstanding unvested RSUs based on our closing stock price on December 31, 2016 of $36.83. The outstanding unvested RSUs reported above will accelerate and vest on an involuntary termination without cause (whether before or after a change in control, although not all outstanding RSUs may vest on such a termination before a change in control), retirement, death or disability. For certain terminations of employment, the accelerated vesting is subject to a requirement that Mr. Martell signs a general release of claims and complies with certain post-termination covenants and confidentiality provisions in the employment agreement.
(8)Represents the value after acceleration of all outstanding unvested PBRSUs based on our closing stock price on December 31, 2016 of $36.83. All or a pro-rata portion of outstanding unvested PBRSUs will generally accelerate on death, disability or involuntary termination without cause following a change in control, subject to attainment of the performance measures for any termination prior to a change in control. We have assumed that the target number of PBRSUs would become vested in connection with each acceleration event, although the actual number of PBRSUs that could become vested could be higher or lower than the target number of PBRSUs, based on actual performance.
(9)Refers to payments accrued under the Deferred Compensation Plan as of December 31, 2016 based on Mr. Martell's salary deferral election and 401(k) restoration contributions.
(10)Represents the cost of continued health and welfare benefits for 24 months after the date on which the termination occurs. These obligations are reduced by any welfare benefits made available to the executive officer from subsequent employers.
(11)Represents the cost of continued health and welfare benefits for 24 months after the date on which the termination occurs subject to the executive's continued payment of the same premium payment amount as immediately prior to termination. These obligations are reduced by any welfare benefits made available to the executive officer from subsequent employers.
Table of Contents
| | | | | | | | | | | | | | | | | | | | | | | | | | | | |
| |
| |
| |
| |
| |
| |
| |
| |
|
|---|
| | | | | | | | | | | | | | | | | | | | | James Balas |
| | | | | | | | | | | | | | | | | | | | | | | Potential Payments upon Termination or Change in Control
|
| | | | | | | | | | | | | | | | | | | | | | | | | | | | | Involuntary Termination | | Change in Control (1) | | | | | | | | | | | | | | | | | | | | | | | | | | | | Executive Payments and Benefits Upon Termination | | Voluntary
Resignation
($) | | For Cause
($) | | Without
Cause
($) | |
With Termination
for Good Reason/
Without Cause
($) | | Death
($) | | Disability
($) | | | | | | | | | | | | | | | | | | | | | | | | Compensation | | | | | | | | | | | | | | | | | | | | | | | | Severance | | | — | | | | — | | | 807,500 | (2) | | 1,615,000 | (3) | | — | | — | | | | | | Bonus | | | — | | | | — | | | 531,700 | (4) | | 382,500 | (5) | | 382,500 | | 382,500 | | | | | | Accelerated Vesting — Options (6) | | | — | | | | — | | | — | | | 5,343 | | | 5,343 | | 5,343 | | | | | | Accelerated Vesting — RSU (7) | | | — | | | | — | | | 454,003 | | | 454,003 | | | 454,003 | | 454,003 | | | | | | Accelerated Vesting — PBRSU (8) | | | — | | | | — | | | — | | | 478,864 | | | 478,864 | | 478,864 | | | | | | Deferred Compensation (9) | | | 264,701 | | | | 264,701 | | | 264,701 | | | 264,701 | | | 264,701 | | 264,701 | | | | | | Benefit Continuation | | | — | | | | — | | | 21,489 | (10) | | 26,293 | (11) | | — | | — | | | | | | Total | | | 264,701 | | | | 264,701 | | | 2,079,393 | | | 3,226,704 | | | 1,585,411 | | 1,585,411 | | | | | | | | | | | | | | | | | | | | |
(1)In accordance with SEC rules, an excise calculation is not presented in this table as we do not provide a gross-up or tax reimbursement to our NEOs in connection with a change in control. Amounts payable to Mr. Balas in the event of a change in control may be subject to reduction under Sections 280G and 4999 of the Code.
(2)Represents an amount equal to the sum of (i) Mr. Balas' annualized base salary in effect on the date his employment terminates (the "Severance Date") plus (ii) the target annual Incentive Bonus amount for Mr. Balas in effect on the Severance Date (the "Severance Benefit"). The Severance Benefit will be payable in a lump sum equal to 7/12 of the Severance Benefit on the seventh month after the Severance Date with an additional 1/12 of the Severance Benefit paid each month until the month which is 12 months after the Severance Date. Receipt of the benefit is contingent upon execution of a general release of claims and compliance with certain post-termination covenants and confidentiality provisions in the employment agreement.
(3)Represents two times Mr. Balas' base salary in effect immediately prior to the date of termination by us and two times Mr. Balas' target annual cash bonus established for fiscal year 2016. Receipt of the benefit is contingent upon execution of a general release of claims.
(4)Represents the pro rata portion of Mr. Balas' annual cash bonus for fiscal year 2016. Mr. Balas' agreement provides for the payment of the pro rata portion of the bonus amount he would have received had his employment not terminated during the fiscal year. Such payment is required to be paid within two and one-half months following fiscal year end. Receipt of the benefit is contingent upon execution of a general release of claims and compliance with certain post-termination covenants and confidentiality provisions in the employment agreement.
(5)Represents the pro rata portion of Mr. Balas' target annual cash bonus for the year of termination. Mr. Balas' agreement provides for the payment of the target annual cash bonus established for fiscal year 2016. Receipt of the benefit is contingent upon execution of a general release of claims.
(6)Outstanding unvested stock options will generally accelerate on death, disability or involuntary termination without cause in connection with a change in control. Mr. Balas held a total of 1,231 unvested stock options with exercise prices less than $36.83, the closing stock price on December 31, 2016, and the amount shown represents the difference between $36.83 and the exercise prices for the unvested options, multiplied by the applicable number of unvested options.
(7)Represents the value after acceleration of outstanding unvested RSUs based on our closing stock price on December 31, 2016 of $36.83. The outstanding unvested RSUs reported above will accelerate and vest on an involuntary termination without cause (whether before or after a change in control, although not all outstanding RSUs may vest on such a termination before a change in control), retirement, death or disability. For certain terminations of employment, the accelerated vesting is subject to a requirement that Mr. Balas signs a general release of claims and complies with certain post-termination covenants and confidentiality provisions in the employment agreement.
(8)Represents the value after acceleration of all outstanding unvested PBRSUs based on our closing stock price on December 31, 2016 of $36.83. All or a pro-rata portion of outstanding unvested PBRSUs will generally accelerate on death, disability or involuntary termination without cause following a change in control, subject to attainment of the performance measures for any termination prior to a change in control. We have assumed that the target number of PBRSUs would become vested in connection with each acceleration event, although the actual number of PBRSUs that could become vested could be higher or lower than the target number of PBRSUs, based on actual performance.
(9)Refers to payments accrued under the Deferred Compensation Plan as of December 31, 2016 based on Mr. Balas' salary deferral election and 401(k) restoration contributions.
Table of Contents
(10)Represents the cost of COBRA coverage for 12 months after the date on which the termination occurs at the cost applicable to active employees (subject to earlier termination if Mr. Balas becomes eligible for comparable coverage under another employer's plan and certain alternative payments if COBRA coverage cannot be provided under our plans in effect on the date of termination).
(11)Represents the cost of continued health and welfare benefits for 18 months after the date on which the termination occurs subject to the executive's continued payment of the same premium payment amount as immediately prior to termination. These obligations are reduced by any welfare benefits made available to the executive officer from subsequent employers.
| | | | | | | | | | | | | | | | | | | | | | | | | | |
| |
| |
| |
| |
| |
| |
| |
| |
|
|---|
| | | | | | | | | | | | | | | | | | | | | Barry M. Sando |
| | | | | | | | | | | | | | | | | | | | | | | Potential Payments upon Termination or Change in Control
|
| | | | | | | | | | | | | | | | | | | | | | | | | | | | | Involuntary Termination | | Change in Control (1) | | | | | | | | | | | | | | | | | | | | | | | | | | | | Executive Payments and Benefits Upon Termination | | Voluntary
Resignation
($) | | For Cause
($) | | Without
Cause
($) | |
With Termination
for Good Reason/
Without Cause
($) | | Death
($) | | Disability
($) | | | | | | | | | | | | | | | | | | | | | | | | Compensation | | | | | | | | | | | | | | | | | | | | | | Severance | | | — | | | — | | 2,200,000 | (2) | | 3,300,000 | (3) | | — | | — | | | | | | Bonus | | | — | | | — | | 740,000 | (4) | | 550,000 | (5) | | 550,000 | | 550,000 | | | | | | Accelerated Vesting — Options (6) | | | — | | | — | | — | | | 26,717 | | | 26,717 | | 26,717 | | | | | | Accelerated Vesting — RSU (7) | | | 113,363 | | | — | | 1,095,508 | | | 1,095,508 | | | 1,095,508 | | 1,095,508 | | | | | | Accelerated Vesting — PBRSU (8) | | | — | | | — | | — | | | 1,183,311 | | | 1,183,311 | | 1,183,311 | | | | | | Deferred Compensation Plan (9) | | | 931,630 | | | 931,630 | | 931,630 | | | 931,630 | | | 931,630 | | 931,630 | | | | | | Vested Pension Restoration Plan | | | 105,928 | | | 105,928 | | 105,928 | | | 105,928 | | | 53,814 | | 105,928 | | | | | | Vested Executive Supplemental Benefit Plan (10) | | | 4,786,962 | | | 4,786,962 | | 4,786,962 | | | 6,815,151 | (11) | | 2,644,882 | (12) | 4,786,962 | (13) | | | | | Benefit Continuation | | | — | | | — | | 43,828 | (14) | | 52,586 | (15) | | — | | — | | | | | | Total | | | 5,937,883 | | | 5,824,520 | | 9,903,856 | | | 14,060,831 | | | 6,485,862 | | 8,680,056 | | | | | | | | | | | | | | | | | | | | |
(1)In accordance with SEC rules, an excise calculation is not presented in this table as we do not provide a gross-up or tax reimbursement to our NEOs in connection with a change in control. Amounts payable to Mr. Sando in the event of a change in control may be subject to reduction under Sections 280G and 4999 of the Code.
(2)Represents an amount equal to two times the sum of (i) Mr. Sando's annualized base salary in effect on the date his employment terminates (the "Severance Date") plus (ii) the target annual Incentive Bonus amount for Mr. Sando in effect on the Severance Date (the "Severance Benefit"). The Severance Benefit will be payable in a lump sum equal to 7/24 of the Severance Benefit on the seventh month after the Severance Date with an additional 1/24 of the Severance Benefit paid each month until the month which is 24 months after the Severance Date. Receipt of the benefit is contingent upon execution of a general release of claims and compliance with certain post-termination covenants and confidentiality provisions in the employment agreement.
(3)Represents three times Mr. Sando's base salary in effect immediately prior to the date of termination by us and three times Mr. Sando's target annual cash bonus established for fiscal year 2016. Receipt of the benefit is contingent upon execution of a general release of claims.
(4)Represents the pro rata portion of Mr. Sando's annual cash bonus for fiscal year 2016. Mr. Sando's agreement provides for the payment of the pro rata portion of the bonus amount he would have received had his employment not terminated during the fiscal year. Such payment is required to be paid within two and one-half months following fiscal year end. Receipt of the benefit is contingent upon execution of a general release of claims and compliance with certain post-termination covenants and confidentiality provisions of the employment agreement.
(5)Represents the pro rata portion of Mr. Sando's target annual cash bonus for the year of termination. Mr. Sando's agreement provides for the payment of the target annual cash bonus established for fiscal year 2016. Receipt of the benefit is contingent upon execution of a general release of claims.
(6)Outstanding unvested stock options will generally accelerate on death, disability or involuntary termination without cause in connection with a change in control. Mr. Sando held a total of 6,156 stock options with an exercise price of less than $36.83, the closing stock price on December 31, 2016, and the amount shown represents the difference between $36.83 and the exercise prices for the unvested options, multiplied by the applicable number of unvested options.
(7)Represents the value after acceleration of outstanding RSUs based on our closing stock price on December 31, 2016 of $36.83. The outstanding unvested RSUs reported above will accelerate and vest on an involuntary termination without cause (whether
Table of Contents
before or after a change in control, although not all outstanding RSUs may vest on such a termination before a change in control), retirement, death or disability. For certain terminations of employment, the accelerated vesting is subject to a requirement that Mr. Sando signs a general release of claims and complies with certain post-termination covenants and confidentiality provisions in the employment agreement.
(8)All or a pro-rata portion of outstanding unvested PBRSUs will generally accelerate on death, disability or involuntary termination without cause following a change in control, subject to attainment of the performance measures for any termination prior to a change in control. We have assumed that the target number of PBRSUs would become vested in connection with each acceleration event, although the actual number of PBRSUs that could become vested could be higher or lower than the target number of PBRSUs, based on actual performance.
(9)Refers to payments accrued under the Deferred Compensation Plan as of December 31, 2016 based on Mr. Sando's salary deferral election and 401(k) restoration contributions.
(10)"Executive Supplemental Benefit Plan" represents current vested benefit amount under the various scenarios for the Executive Supplemental Benefit Plan.
(11)Represents the enhanced present value of the benefit calculated using the following assumptions: interest rate of 4.00% post-retirement mortality per RP-2014 Healthy Annuitants table without collar or amount adjustments, adjusted to remove post 2007 improvement projections, with generational projection via Scale MP-2014, modified to use a 10-year convergence period to a long-term improvement rate of 1.0% by 2017. Upon an involuntary termination without cause after a change in control of us, Mr. Sando becomes 100% vested in the benefit in the amount Mr. Sando would have been entitled to receive in accordance with the provisions of the plans in effect on the date of the change of control.
(12)Represents pre-retirement death benefit in the form of a single life annuity payable to the executive's spouse or domestic partner, calculated as what the executive would have received had he incurred a termination of employment on his normal retirement date and then died immediately thereafter.
(13)Represents the present value of the benefit calculated using the following assumptions: interest rate of 4.00% post-retirement mortality per RP-2014 Healthy Annuitants table without collar or amount adjustments, adjusted to remove post 2007 improvement projections, with generational projection via Scale MP-2014, modified to use a 10-year convergence period to a long-term improvement rate of 1.0% by 2017 deferred to the earliest retirement age.
(14)Represents the cost of COBRA coverage for 24 months after the date on which the termination occurs at the cost applicable to active employees (subject to earlier termination if Mr. Sando becomes eligible for comparable coverage under another employer's plan and certain alternative payments if COBRA coverage cannot be provided under our plans in effect on the date of termination).
(15)Represents the cost of continued health and welfare benefits for 36 months after the date on which the termination occurs subject to the executive's continued payment of the same premium payment amount as immediately prior to termination. These obligations are reduced by any welfare benefits made available to the executive officer from subsequent employers.
| | | | | | | | | | | | | | | | | | | | | | | | | | | | |
| |
| |
| |
| |
| |
| |
| |
| |
|
|---|
| | | | | | | | | | | | | | | | | | | | | Stergios Theologides |
| | | | | | | | | | | | | | | | | | | | | | | Potential Payments upon Termination or Change in Control
|
| | | | | | | | | | | | | | | | | | | | | | | | | | | | | Involuntary Termination | | Change in Control (1) | | | | | | | | | | | | | | | | | | | | | | | | | | | | Executive Payments and Benefits Upon Termination | | Voluntary
Resignation
($) | | For Cause
($) | | Without
Cause
($) | |
With Termination
for Good Reason/
Without Cause
($) | | Death
($) | | Disability
($) | | | | | | | | | | | | | | | | | | | | | | | | Compensation | | | | | | | | | | | | | | | | | | | | | | | | Severance | | | — | | | | — | | | 765,000 | (2) | | 1,530,000 | (3) | | — | | — | | | | | | Bonus | | | — | | | | — | | | 450,000 | (4) | | 340,000 | (5) | | 340,000 | | 340,000 | | | | | | Accelerated Vesting — Options (6) | | | — | | | | — | | | — | | | 14,027 | | | 14,027 | | 14,027 | | | | | | Accelerated Vesting — RSU (7) | | | — | | | | — | | | 740,688 | | | 740,688 | | | 740,688 | | 740,688 | | | | | | Accelerated Vesting — PBRSU (8) | | | — | | | | — | | | — | | | 797,738 | | | 797,738 | | 797,738 | | | | | | Deferred Compensation Plan (9) | | | 418,847 | | | | 418,847 | | | 418,847 | | | 861,540 | | | 861,540 | | 861,540 | | | | | | Benefit Continuation | | | — | | | | — | | | 21,742 | (10) | | 26,293 | (11) | | — | | — | | | | | | Total | | | 418,847 | | | | 418,847 | | | 2,396,277 | | | 4,310,286 | | | 2,753,993 | | 2,753,993 | | | | | | | | | | | | | | | | | | | | |
(1)In accordance with SEC rules, an excise calculation is not presented in this table as we do not provide a gross-up or tax reimbursement to our NEOs in connection with a change in control. Amounts payable to Mr. Theologides in the event of a change in control may be subject to reduction under Sections 280G and 4999 of the Code.
Table of Contents
(2)Represents an amount equal to one times the sum of (i) Mr. Theologides' annualized base salary in effect on the date his employment terminates (the "Severance Date") plus (ii) the target annual Incentive Bonus amount for Mr. Theologides in effect on the Severance Date (the "Severance Benefit"). The Severance Benefit will be payable in a lump sum equal to 7/12 of the Severance Benefit on the seventh month after the Severance Date with an additional 1/12 of the Severance Benefit paid each month until the month which is 12 months after the Severance Date. Receipt of the benefit is contingent upon execution of a general release of claims and compliance with certain post-termination covenants and confidentiality provisions in the employment agreement.
(3)Represents two times Mr. Theologides' base salary in effect immediately prior to the date of termination by us and two times Mr. Theologides' target annual cash bonus established for fiscal year 2016. Receipt of the benefit is contingent upon execution of a general release of claims.
(4)Represents the pro rata portion of Mr. Theologides' annual cash bonus for fiscal year 2016. Mr. Theologides' agreement provides for the payment of the pro rata portion of the bonus amount he would have received had his employment not terminated during the fiscal year. Such payment is required to be paid within two and one-half months following fiscal year end. Receipt of the benefit is contingent upon execution of a general release of claims and compliance with certain post-termination covenants and confidentiality provisions of the employment agreement.
(5)Represents the pro rata portion of Mr. Theologides' target annual cash bonus for the year of termination. Mr. Theologides' agreement provides for the payment of the target annual cash bonus established for fiscal year 2016. Receipt of the benefit is contingent upon execution of a general release of claims.
(6)Outstanding unvested stock options will generally accelerate on death, disability or involuntary termination without cause in connection with a change in control. Mr. Theologides held a total of 3,232 unvested stock options with an exercise price of less than $36.83, the closing stock price on December 31, 2016, and the amount shown represents the difference between $36.83 and the exercise prices for the unvested options, multiplied by the applicable number of unvested options.
(7)Represents the value after acceleration of outstanding RSUs based on the Company's closing stock price on December 31, 2016 of $36.83. The outstanding unvested RSUs reported above will accelerate and vest on an involuntary termination without cause (whether before or after a change in control, although not all outstanding RSUs may vest on such a termination before a change in control), retirement, death or disability. For certain terminations of employment, the accelerated vesting is subject to a requirement that Mr. Theologides signs a general release of claims and complies with certain post-termination covenants and confidentiality provisions in the employment agreement.
(8)Represents the value after acceleration of all outstanding unvested PBRSUs based on our closing stock price on December 31, 2016 of $36.83. All or a pro-rata portion of outstanding unvested PBRSUs will generally accelerate on death, disability or involuntary termination without cause following a change in control, subject to attainment of the performance measures for any termination prior to a change in control. We have assumed that the target number of PBRSUs would become vested in connection with each acceleration event, although the actual number of PBRSUs that could become vested could be higher or lower than the target number of PBRSUs, based on actual performance.
(9)Represents contributions by Mr. Theologides and by us on behalf of Mr. Theologides into the Deferred Compensation Plan.
(10)Represents the cost of COBRA coverage for 12 months after the date on which the termination occurs at the cost applicable to active employees (subject to earlier termination if Mr. Theologides becomes eligible for comparable coverage under another employer's plan and certain alternative payments if COBRA coverage cannot be provided under our plans in effect on the date of termination).
(11)Represents the cost of continued health and welfare benefits for 24 months after the date on which the termination occurs subject to the executive's continued payment of the same premium payment amount as immediately prior to termination. These obligations are reduced by any welfare benefits made available to the executive officer from subsequent employers.
other companies. Table of Contents
SECTION 16(A) BENEFICIAL OWNERSHIP REPORTING COMPLIANCE SECTION 16(a) BENEFICIAL OWNERSHIP REPORTING COMPLIANCE |
Rules adopted by the SEC require our officers, as defined under the relevant SEC rules, and directors, and persons who beneficially own more than ten percent of our issued and outstanding common stock, to file reports of their ownership, and changes in ownership, of our shares with the SEC on prescribed forms. Officers, directors andgreater-than-ten-percent beneficial owners are required by the SEC'sSEC’s rules to furnish us with copies of all such forms they file with the SEC. Based solely on the review of the copies of the forms received by us, or written representations from reporting persons that they were not required to file a Form 5 to report previously unreported ownership or changes in ownership, we believe that our officers, directors andgreater-than-ten-percent beneficial owners timely complied with all such filing requirements during fiscal 2016.2018.
Table of Contents
QUESTIONS AND ANSWERS ABOUT VOTING QUESTIONS AND ANSWERS ABOUT VOTING |
Why have I been sent a notice regarding the availability of proxy materials on the Internet?
Pursuant to rules adopted by the SEC, we have elected to provide access to our proxy materials over the Internet. Accordingly, we are sending a Notice to most of our stockholders. All stockholders will have the ability to access the proxy materials on the website referred to in the Notice or request to receive a printed set of the proxy materials. Instructions on how to access the proxy materials over the Internet or to request a printed copy may be found in the Notice. What proposals will be voted on at the Annual Meeting?
1.The election of the nine persons named in this proxy statement to serve on the Board until the next annual meeting and until their successors are duly elected and qualified;
2.The approval, on an advisory basis, of the compensation of our NEOs;
3.The vote, on an advisory basis, on the frequency of future advisory votes on the compensation of our NEOs;
4.The ratification of the selection of PwC as our independent registered public accounting firm for the fiscal year ending December 31, 2017; and
5.The transaction of such other business as may properly come before the Annual Meeting or any postponements or adjournments thereof.
| 1. | The election of the 11 persons named in this proxy statement to serve on the Board until the next annual meeting and until their respective successors are duly elected and qualified; |
| 2. | The approval, on an advisory basis, of the compensation of our NEOs; |
| 3. | The ratification of the selection of PwC as our independent registered public accounting firm for the fiscal year ending December 31, 2019; and |
| 4. | The transaction of such other business as may properly come before the Annual Meeting or any postponements or adjournments thereof. |
Our management and the Board are not aware of any other matters to be presented at the Annual Meeting other than those set forth in this proxy statement and in the notice accompanying this proxy statement, nor have we received notice of any matter by the deadline prescribed byRule 14a-4(c)(1) promulgated under the Exchange Act. Without limiting our ability to apply the advance notice provisions in our Bylaws with respect to the procedures which must be followed for a matter to be properly presented at an annual meeting, if other matters should properly come before the Annual Meeting, the proxy holders will vote on such matters in accordance with their best judgment. Does our Board have any recommendations with respect to the listed proposals? Our Board recommends you vote: (1) “FOR” the election of each of the 11 nominees for director; (2) “FOR” the approval, on an advisory basis, of the compensation of our NEOs; and (3) “FOR” the ratification of the selection of PwC as our independent registered public accounting firm for the fiscal year ending December 31, 2019. Who may attend the Annual Meeting?
Only our stockholders and their invited guests may attend the Annual Meeting. If you are a stockholder of record, you must bring proof of identification. If you hold your shares through a broker, bank or other nominee, you will need to provide proof of ownership — for example, a copy of a brokerage statement showing your share ownership — and proof of identification. Additional documentation is required to vote your shares at the Annual Meeting if you hold your shares through a broker, bank or other nominee. See "How“How can I vote my shares in person at the Annual Meeting?"Meeting?” below for more information. Who is entitled to vote?
Stockholders of record as of the close of business on March 6, 2017,4, 2019, the record date, or those with a valid proxy from a broker, bank or other nominee that held our shares on the record date are entitled to vote on the matters to be considered at the Annual Meeting. Who is a stockholder of record?
A stockholder of record is a person or entity whose name appears as an owner of one or more shares of our common stock on the records of our transfer agent as of its close of business on the record date.
Table of Contents
How can I vote my shares in person at the Annual Meeting?
If you hold shares as a stockholder of record, you have the right to vote those shares in person at the Annual Meeting. If you choose to do so, you can vote using the ballot provided at the Annual Meeting or, if you received a printed set of the proxy materials by mail, by submitting at the Annual Meeting the proxy card enclosed with the proxy materials you received. Since a beneficial holder is not the stockholder of record, ifIf you are a beneficial holder of shares, you may not vote thoseyour shares in person at the Annual Meeting unless you obtain a "legal proxy"“legal proxy” from the broker, bank or other nominee that holds your shares, giving you the right to vote the shares in person at the Annual Meeting using the ballot provided at the meeting. Please note that participants in our 401(k) Savings Plan (the "401(k) Plan"“401(k) Plan”) may not vote their plan shares in person at the Annual Meeting. See "How“How are my shares in the Company'sCompany’s 401(k) Plan voted?"” below for more information. Even if you plan to attend the Annual Meeting, we recommend that you vote your shares in advance as described below so that your vote will be counted if you later decide not to attend the Annual Meeting. How many shares are entitled to vote at the Annual Meeting?
As of the record date, 84,520,00780,126,108 shares of our common stock were issued, outstanding and entitled to vote at the Annual Meeting. How many votes do I have?
Each share of CoreLogicthe Company’s common stock, excluding treasury shares, is entitled to one vote on each of the nine11 director nominees and on each other proposal to be voted on at the Annual Meeting. How many directors can I vote for?
Nine.Eleven. At the Annual Meeting, stockholders may vote for“for” or “against” the election to our Board of upeach of the 11 nominees for director. Stockholders may also abstain from voting with respect to nineany of the 11 nominees for director.
Who are the director nominees?
The nine11 director nominees are: J. David Chatham, Douglas C. Curling, John C. Dorman, Paul F. Folino, Frank D. Martell, Claudia Fan Munce, Thomas C. O’Brien, Vikrant Raina, Jaynie Miller Studenmund, David F. Walker, and Mary Lee Widener. | | | J. David Chatham | | Thomas C. O'Brien | Douglas C. Curling | | Jaynie Miller Studenmund | John C. Dorman | | David F. Walker | Paul F. Folino | | Mary Lee Widener | Frank D. Martell | | |
What is the voting requirement to approve each of the proposals?
Proposal 1 – Election of Directors Because the number of director nominees timely nominated for election at the Annual Meeting does not exceed the number of directors to be elected at the Annual Meeting, our Bylaws provide that each director nominee will be elected to the Board to serve until the next annual meeting and as soon thereafter as their successors arehis or her successor is duly elected and qualified, if the nominee receives a majority of votes cast with respect to such director nominee'snominee’s election. A "majority“majority of votes cast"cast” means that the number of votes "for"“for” a director nominee must exceed the number of votes "against"“against” that director nominee.
Table of Contents
Proposal 2 – Approval, on an Advisory Basis, of the Compensation of our NEOs Approval, on an advisory basis, of the compensation of our NEOs requires the affirmative vote of the holders of a majority of shares of common stock present in person or represented by proxy and entitled to vote on the matter (meaning that of the shares represented at the meeting and entitled to vote on the proposal, a majority of them must be voted "for"“for” the proposal for it to be approved). Proposal 3 – Vote, on an Advisory Basis, on the Frequency of Future Advisory Votes on the Compensation of our NEOs The affirmative vote of a majority of the shares of our common stock represented in person or by proxy at the Annual Meeting and entitled to vote on the proposal is required to approve, on a non-binding, advisory basis, a frequency option for future advisory votes on executive compensation (meaning that of the shares represented at the meeting and entitled to vote on the proposal, a majority of them must be voted in favor of one of the frequency options for it to be approved). However, if no frequency option receives the affirmative vote of at least a majority of the shares present in person or represented by proxy and entitled to vote on the proposal at the Annual Meeting, then the Board of Directors will consider the option receiving the highest number of votes as the preferred option of the stockholders.
Proposal 4 – Ratification of the Selection of PwC as our Independent Registered Public Accounting Firm for the Fiscal Year Ending December 31, 20172019
The selection of PwC as our independent registered public accounting firm for the fiscal year ending December 31, 20172019 will be ratified if the affirmative vote of the holders of a majority of shares of common stock present in person or represented by proxy and entitled to vote on the matter (meaning that of the shares represented at the meeting and entitled to vote on the proposal, a majority of them must be voted "for"“for” the proposal for it to be approved). How do I vote?
If you are a stockholder of record, you may vote on matters that properly come before the Annual Meeting in one of four ways: You may vote over the Internet. You do this by following the instructions provided either in the Notice or on the proxy card accompanying thethis proxy statement if you received a printed set of the proxy materials. If you submit your proxy over the Internet, your shares will be voted as you instruct. You do not have to separately mail in your proxy card. You may vote by mail. If you received a printed set of the proxy materials, you do this by signing and dating the proxy card accompanying thethis proxy statement and mailing it in the enclosed, prepaid and addressed envelope within the required time. If you mark your voting instructions on the proxy card, your shares will be voted as you instruct. You may vote by telephone. You do this by following the instructions provided on the proxy card accompanying thethis proxy statement if you received a printed set of the proxy materials. If you submit your proxy by telephone, your shares will be voted as you instruct. You do not have to separately mail in your proxy card.
Table of Contents
You may vote in person at the Annual Meeting. You can vote your shares in person at the Annual Meeting. If you choose to do so, you can vote using the ballot provided at the Annual Meeting, or, if you requested and received printed copies of the proxy materials by mail, you can complete, sign and date the proxy card enclosed with the proxy materials you received and submit it at the Annual Meeting. If you hold your shares in "street“street name,"” you will receive instructions from your broker, bank or other nominee that you must follow in order to instruct how your shares are to be voted at the Annual Meeting. If youyour shares are held in "street“street name,"” you may also attend the Annual Meeting and vote your shares in person, provided that you request and receive, prior to the Annual Meeting, a "legal proxy"“legal proxy” from the broker, bank or other nominee that holds your shares giving you the right to vote the shares at the Annual Meeting and present the legal proxy at the meeting prior to voting. If your shares are held through the 401(k) Plan, please see "How are my shares in the Company's 401(k) Plan voted?" below. “How are my shares in the Company'sCompany’s 401(k) Plan voted?
” below. How are my shares in the Company’s 401(k) Plan voted? For those stockholders who hold shares pursuant to the 401(k) Plan, Fidelity Management Trust Company ("Fidelity"(“Fidelity”) acts as trustee for shares held in the 401(k) Plan. The governing documents of the 401(k) Plan require Fidelity, as trustee, to vote the shares as directed by the plan participants for whose benefit the shares are held. Fidelity will use an independent third party to tabulate the voting directions of all participants who provide such directions to Fidelity. Neither the tabulator nor Fidelity will provide the individual or aggregate participant voting directions to the Company, unless otherwise required by law. Shares for which no direction is received by Fidelity from the participants by April 28, 201725, 2019 at 5:00 p.m., Eastern time, will be voted in the same proportion as are the shares for which directions are received by that time.
How will my shares be voted if I do not provide specific voting instructions in the proxy I submit?
The named proxy holders, Frank D. Martell President and Chief Executive Officer, or Stergios Theologides, Senior Vice President, General Counsel and Secretary,Arnold A. Pinkston, will vote your shares in the manner recommended by our Board with respect to the three proposals included in this proxy statement and as such proxy holders may determine in accordance with their best judgment with respect to any other matters properly presented for a vote at the Annual Meeting. Can I change my vote or revoke my proxy?
You have the power to change or revoke your proxy at any time before the polls close at the Annual Meeting. Only yourlatest-dated proxy counts. You may do this by: •submitting an authorized proxy bearing a later date using one of the alternatives described above under "How do I vote?";
•| • | | submitting an authorized proxy bearing a later date using one of the alternatives described above under “How do I vote?”; |
if you are a stockholder of record, submitting written notice of your revocation to Stergios Theologides, Senior Vice President, General CounselArnold A. Pinkston, Chief Legal Officer and Corporate Secretary, at our mailing address on the cover page of this proxy statement; or
•voting in person at the Annual Meeting, provided that if your shares are held in "street name"“street name” (in the name of a bank, broker or other nominee), you have obtained a legal proxy from your bank, broker or other nominee giving you the right to vote your shares in person at the Annual Meeting. Attendance at the Annual Meeting will not by itself constitute revocation of a proxy. Who will count the votes?
A representative of Alliance Advisors, LLC ("Alliance Advisors") will serve as inspector of elections and will tabulate the votes cast at the Annual Meeting and certify the results.
Table of Contents
How can I obtain an additional proxy card?
If you lose, misplace or otherwise need to obtain a proxy card, and you are a stockholder of record, please contact our proxy solicitor, Alliance Advisors,toll-free at1-855-325-6671. If you are a beneficial owner of shares held indirectly through a broker, bank or other nominee, please contact your account representative at that organization. What constitutes a "quorum?"
“quorum?” A "quorum"“quorum” refers to the number of shares that must be represented at a meeting in order to lawfully conduct business. Holders of a majority in voting power of all issued and outstanding shares of common stock entitled to vote at the Annual Meeting, present in person or represented by proxy, will constitute a quorum at the Annual Meeting. Without a quorum, no business may be transacted at the Annual Meeting. Abstentions and brokernon-votes (as described below) are counted as present and entitled to vote for purposes of determining the presence or absence of a quorum. What is a "broker non-vote"“brokernon-vote” and how is it treated?
If you are a beneficial owner of shares held in "street name"“street name” by a broker and you do not submit voting instructions to your broker, your broker may vote your shares at the Annual Meeting only on "routine matters"“routine matters” (as defined by NYSE rules) on which it has discretion to vote. The NYSE currently considers only Proposal 43 — the proposal to ratify the selection of PwC as our independent registered public accounting firm for the fiscal year ending December 31, 20172019 — to be a "routine“routine matter."” The following proposals are considered "non-routine matters"“non-routine matters” under the NYSE rules: •the election to the Board of the nine11 director nominees named in this proxy statement;
•- and
the proposal to approve, on an advisory basis, the compensation of our NEOs; and
•the vote, on an advisory basis, on the frequency of future advisory votes on the compensation of our NEOs.Accordingly, if your shares are held in "street name"“street name” and your broker has not received voting instructions from you, your broker may exercise its discretion to vote your shares on the proposal to ratify the selection of PwC as our independent registered public accounting firm, but will not be permitted to vote your shares on any of the
other proposals at the Annual Meeting. If your broker exercises this discretion, your shares will be treated as present and entitled to vote at the Annual Meeting for purposes of establishing the presence or absence of a quorum and voted on the proposal to ratify the selection of PwC in the manner directed by the broker, but will constitute "broker non-votes"“brokernon-votes” on each of the other proposals at the Annual Meeting. These brokernon-votes will not be counted in determining the outcome of any of the other proposals. How are abstentions treated?
For the election of directors, you may vote "for," "against,"“for,” “against,” or "abstain"“abstain” with respect to each director nominee. If you elect to "abstain"“abstain” from the election of directors, the abstention will not have any effect on the election of directors. In determining the voting results for the election of directors, only "for"“for” and "against"“against” votes count. For purposes of the proposals regarding the vote to approve, on an advisory basis, the compensation of our NEOs, the vote, on an advisory basis, on the frequency of future advisory votes on the compensation of our NEOs, and the vote to ratify the selection of PwC as our independent registered public accounting firm for the fiscal year ending December 31, 2017,2019, abstentions are treated as present and entitled to vote. Therefore, with respect to each of these proposals, (other than the vote, on an advisory basis, on the
Table of Contents
frequency of future advisory votes on the compensation of our NEOs), abstentions have the effect of votes "AGAINST"“AGAINST” the proposal. With respect to the vote, on an advisory basis, on the frequency of future advisory votes on the compensation of our NEOs, abstentions have the effect of votes "AGAINST" each of the frequency options in determining whether any of the frequency options has been approved by a majority of the shares of our common stock represented at the Annual Meeting and entitled to vote on the proposal, but will not be counted in determining the frequency option receiving the highest number of votes.
What percentage of stock do the directors and executive officers own?
As of the record date, our directors and executive officers owned approximately one percent of our shares of common stock in the aggregate that are entitled to vote at the Annual Meeting.
Who is paying the cost of preparing, assembling and mailing the notice of the annual meeting of stockholders, proxy statement and form of proxy, and the solicitation of the proxies?
We will pay the costs associated with the preparation, assembly and mailing of the Notice, proxy statement and form of proxy, as well as the cost of soliciting proxies relating to the annual meeting. We will also pay brokers, banks and other nominees for the reasonable expenses of forwarding solicitation materials to their customers who own shares of our common stock. In addition to this proxy statement, our directors, officers and other regular administrative employees may solicit proxies. None of them will receive any additional compensation for such solicitation. We may conduct further solicitations of stockholders by telephone,e-mail, through press releases issued by us, advertisements in periodicals or postings on our website atwww.corelogic.com through our officers, directors and employees, none of whom will receive additional compensation for assisting with the solicitation. We have also retained Alliance Advisors to assist in the solicitation of proxies and related services, for a fee estimated to be approximately $19,500 plus an amount to cover expenses. In addition, we have agreed to indemnify Alliance Advisors against certain liabilities arising out of or in connection with the engagement. How do I obtain a separate set of proxy materials if I share an address with other stockholders?
To reduce expenses, in some cases, we are delivering one set of proxy materials to certain stockholders who share an address, unless otherwise requested. Upon oral or written request, we will deliver promptly a separate copy of the proxy materials to a stockholder at a shared address to which a single copy of proxy materials was delivered. If you are a stockholder of record at a shared address to which we delivered a single copy of the proxy materials and you desire to receive a separate copy of the proxy materials, including our 20162018 Annual Report, for the Annual Meeting or for our future meetings of stockholders, or if you are a stockholder at a shared address to which we delivered multiple copies of the proxy materials and you desire to receive one copy in the future, please submit your request to: ALLIANCE ADVISORS, LLC
200 Broadacres Drive, 3rd Floor
Bloomfield, New Jersey 07003 Stockholders May CallToll-Free:855-325-6671 If you hold your shares through a broker, bank or other nominee, please contact your broker, bank or other nominee directly if you have questions, require additional copies of the proxy materials, or wish to request single or multiple copies of the proxy materials in the future. Does our Board have any recommendations with respect to the listed proposals?
Our Board recommends you vote: (1) "FOR" the Board's nine nominees for director; (2) "FOR" the approval, on an advisory basis, of the compensation of our NEOs; (3) "EVERY ONE YEAR" with respect to
Table of Contents
the frequency of future advisory votes on the compensation of our NEOs; and (4) "FOR" the ratification of the selection of PwC as our independent registered public accounting firm for the fiscal year ending December 31, 2017.
Where can I find the voting results of the Annual Meeting?
We will announce preliminary voting results as soon as possible after the Annual Meeting. If final voting results are not available to us in time to file a Current Report onForm 8-K with the SEC within four business days after the Annual Meeting, we intend to file with the SEC a Current Report onForm 8-K to disclose preliminary voting results and, within four business days after the final results are known, we will file an amendment to thatForm 8-K to disclose the final voting results. Whom can I contact if I have questions or need assistance in voting my shares, or if I need additional copies of the proxy materials?
Please contact Alliance Advisors, the firm assisting the Board in the solicitation of proxies, at: ALLIANCE ADVISORS, LLC
200 Broadacres Drive, 3rd Floor
Bloomfield, New Jersey 07003 Stockholders May CallToll-Free:855-325-6671 STOCKHOLDER PROPOSALS Requirements for Director Nominations and Stockholder Proposals to be Brought Before an Annual Meeting. In order for a director nomination or a proposal by you or a fellow stockholder to be considered properly brought before an annual meeting, the stockholder must have given timely notice in writing to our Secretary. A stockholder'sstockholder’s notice to our Secretary shall set forth certain information concerning the stockholder and each director nomination or proposal, as specified in Section 2.10 of our Bylaws, and must comply with the other requirements specified in Section 2.10 of our Bylaws. To be timely for the 20182020 annual meeting of stockholders, the notice must be delivered or mailed to and received by our Corporate Secretary betweenat our principal executive offices not later than the close of business on January 3, 2018 and February 2, 2018.1, 2020 nor earlier than the close of business on January 31, 2020. Requirements for Stockholder Proposals to be Considered for Inclusion in our Proxy Materials. Stockholders interested in submitting a proposal for inclusion in the proxy statement for our 20182020 annual meeting of stockholders may do so by following the procedures prescribed inRule 14a-8 under the Exchange Act. The proposal must be received by us at our principal executive offices not later than November 20, 20172019 in order to be considered for inclusion in our proxy materials for the 20182020 annual meeting of stockholders.
Table of Contents
GENERAL INFORMATION We will, upon the written request of any stockholder on the record date for the Annual Meeting, furnish without charge a copy of our Annual Report onForm 10-K filed with the SEC for the fiscal year ended December 31, 20162018 and will furnish, at a charge of $10, a copy of the exhibits thereto. Such request should contain a representation that the person requesting this material was a beneficial owner of our shares on the record date. Such request should be sent to the General CounselChief Legal Officer at our address indicated on the first page of this proxy statement. The Board is not aware of any matters to come before the Annual Meeting other than those set forth on the notice accompanying this proxy statement. If any other matters come before the Annual Meeting, the holders of the proxies will vote thereon in accordance with their best judgment. | | | | | By Order of the Board of Directors |
|
|
 | | | Stergios Theologides
Senior Vice President, General Counsel and Secretary |
|
|
Irvine, California
March 20, 2017 |
Table of Contentsthe Board of Directors

Arnold A. Pinkston Chief Legal Officer and Corporate Secretary Irvine, California March 19, 2019 CORPORATE SOCIAL RESPONSIBILITY CORPORATE SOCIAL RESPONSIBILITY |
Corporate social responsibility is not just the right thing to do at CoreLogic, it’s an essential enabler of bringing our vision of powering the global real estate economy to life, one household at a time. Information is at the core of smart decision making. CoreLogic uses the power of information, technology and services to help businesses and consumers connect to improve lives and create a better world. This serves as the founding principle of our commitment to corporate social responsibility and is translated into action through:through our efforts to make a difference in the communities where we live and work. Our dedication to our communities includes global programs that draw on our people, products and resources to strengthen financial empowerment. We believe that access to education, financial literacy, and safe and affordable housing contribute to financial independence. Investment in our communities. This includes financial investments, in-kind contributions and employee volunteerism. One of our CORE values is to make a meaningful difference in the communities where we live and work. This is broughtwork through engagement. We strive to life though nationalsupport our communities through partnerships (including Operation HOPE, Marine Corps Scholarship Foundation, Habitat for Humanity, American Heart Association, and localthe Boys & Girls Clubs of America), programs and initiatives in supportthat arebuilt-to-last. We encourage our employees to give back through volunteerism and we contribute through direct andin-kind giving, including providing our employees with up to 16 hours of affordable housing initiatives, community reinvestment through research, and financial literacy to underbanked populations.paid time off annually for volunteer service. Commitment to a positive, diverse and inclusive experience for all employees.We are committed to maximizing the potential of our employees, our communities and the value we create for our stockholders. Diversity and inclusion are woven intointegral contributors to our business and workplace culture. We believe that building a diverse and inclusive culture is critical to winning in the workplace, in the marketplace and in the community. We demonstrate this by: Our commitment to an inclusive environment. This demonstrates a deeper commitment to maximizing
Setting measurable goals that advance our vision of leveraging the potentialleadership, collaboration and contributions of our employees, our communitiestalented workforce to deliver unique property insights that power the global real estate economy; Deployingindustry-leading talent acquisition, development and the value we createcareer growth programs that elevatehigh-potential diverse talent; Acquiring a broad and varied candidate pool oftop-tier talent through targeted alliances with outreach partners including organizations focused on ethnic diversity, women and military veterans; Sponsoringemployee-led networks that inspire personal and professional development and serve as conduits for diversity initiatives; Encouraging and supporting mentoring opportunities to champion talent and broaden development opportunities for our stockholders. This commitment is demonstrated through:workforce; and | | | | | ➢ | | Ensuring accountability and execution of corporate social responsibility programs through enterprise networks and governance by an enterprise diversity advisory council; |
|
➢ |
|
Elevating high-potential diverse talent through job enrichment and leadership development programs; |
|
➢ |
|
Acquiring a broad and varied candidate spectrum of top-tier talent via targeted alliances with outreach partners to include organizations focused on ethnic diversity, women and military veterans; |
|
➢ |
|
Establishing employee-led networks that inspire personal and professional development and serve as conduits for diversity initiatives; and |
|
➢ |
|
Encouraging and supporting mentoring opportunities to champion talent and broaden development opportunities for our workforce. |
Holding ourselves accountable for delivering on our goals through effective governance. CoreLogic is an Equal Employment Opportunity employer.We are committed to providing a workplace environment free from discrimination and harassment. We advance this agenda through trainingonboarding and orientationtraining for all employees;employees, consistent administration of related employment practices and policies;policies, and alignment of expectations and communications to all vendors and supplier partners. We are steadfast in our investment toin bridging community and business goals to discover strategic solutions on a global stage and to continue to explore innovative ways to drive societal investmentsprogress that strengthenstrengthens our communities and influenceinfluences positive and lasting change.
Table of Contents
APPENDIX A – UNAUDITED RECONCILIATION OFNON-GAAP ADJUSTED NUMBERS
FINANCIAL MEASURES
This proxy statement contains certainnon-GAAP financial measures, such as adjusted EBITDA, adjusted EPS and FCF, which are provided only as supplemental information. The Company uses thesenon-GAAP adjusted financial measures to evaluate the company'sCompany’s operating and financial performance and for planning purposes, and as performance measures in its executive compensation program. The Company believes that its presentation of non-GAAP measures provides useful supplemental information to investors and management regarding CoreLogic's financial condition and results. Investors should consider these non-GAAP financial measures only in conjunction with the most directly comparable GAAP financial measures. These non-GAAP measures are not in accordance with or a substitute for U.S. GAAP. Other firms may calculate non-GAAP measures differently than CoreLogic, which limits comparability between companies. Adjusted EBITDA is defined as net income from continuing operations adjusted for interest, taxes, depreciation and amortization, stockshare-based compensation,non-operating gains/losses, and other adjustments. Adjusted EPS is defined as diluted income from continuing operations, net of tax per share, adjusted for stockshare-based compensation, amortization of acquisition-related intangibles,non-operating gains/losses, and other adjustments; tax affected atand assumes an assumed effective tax rate of 35%, 36%26% and 35% for 2017, 20162018 and 2015,2017, respectively. FCF is defined as net cash provided by continuing operating activities less capital expenditures for purchases of property and equipment, capitalized data and other intangible assets. A reconciliation of Investors should consider thesenon-GAAP financial measures toonly in conjunction with the most directly comparable GAAP financial measures. Thesenon-GAAPmeasures is included below.are not in accordance with or a substitute for U.S. GAAP. Other firms may calculatenon-GAAP measures differently than CoreLogic, which limits comparability between companies. CORELOGIC, INC.
RECONCILIATION OF ADJUSTED EBITDA
UNAUDITED | | | | | | | | | | | | | | | | |
| | For the Year Ended December 31, 2016 | |
|---|
(in thousands)
| | PI
| | RMW
| | Corporate
| | Elim
| | CoreLogic
| |
|---|
| | | | | | | | | | | | | | | | | | Net income/(loss) from continuing operations | | $ | 90,119 | | $ | 252,997 | | $ | (233,170 | ) | | — | | $ | 109,946 | | Income taxes | | | — | | | — | | | 55,537 | | | — | | | 55,537 | | Depreciation and amortization | | | 126,367 | | | 28,652 | | | 17,559 | | | — | | | 172,578 | | Interest expense | | | 2,342 | | | — | | | 55,441 | | | — | | | 57,783 | | Stock-based compensation | | | 12,879 | | | 5,460 | | | 21,510 | | | — | | | 39,849 | | Non-operating losses | | | 10,399 | | | — | | | 42,783 | | | — | | | 53,182 | | Efficiency investments | | | — | | | — | | | 1,446 | | | — | | | 1,446 | | Transaction costs | | | 2,748 | | | — | | | 4,111 | | | — | | | 6,859 | | Amortization of acquired intangibles included in equity in earnings of affiliates | | | 2,890 | | | — | | | — | | | — | | | 2,890 | | | | | | | | | | | | | | | | | | | | Adjusted EBITDA | | $ | 247,744 | | $ | 287,109 | | $ | (34,783 | ) | | — | | $ | 500,070 | | | | | | | | | | | | | | | | | | | | | | | | | | | | | | | | | | | | | | | | | | | | | | | | | | | | | | | |
| | | | | | | | | | | | | | | | |
| | For the Year Ended December 31, 2015 | |
|---|
(in thousands)
| | PI
| | RMW
| | Corporate
| | Elim
| | CoreLogic
| |
|---|
| | | | | | | | | | | | | | | | | | Net income/(loss) from continuing operations | | $ | 94,522 | | $ | 216,147 | | $ | (181,117 | ) | | — | | $ | 129,552 | | Income taxes | | | — | | | — | | | 66,494 | | | — | | | 66,494 | | Depreciation and amortization | | | 96,766 | | | 37,493 | | | 16,118 | | | — | | | 150,377 | | Interest expense | | | 784 | | | 31 | | | 60,475 | | | — | | | 61,290 | | Stock-based compensation | | | 8,251 | | | 5,581 | | | 21,954 | | | — | | | 35,786 | | Non-operating losses | | | — | | | — | | | (33,884 | ) | | — | | | (33,884 | ) | Efficiency investments | | | 368 | | | 1,036 | | | 6,108 | | | — | | | 7,512 | | Transaction costs | | | 2,074 | | | — | | | 3,451 | | | — | | | 5,525 | | | | | | | | | | | | | | | | | | | | Adjusted EBITDA | | $ | 202,765 | | $ | 260,288 | | $ | (40,401 | ) | | — | | $ | 422,652 | | | | | | | | | | | | | | | | | | | | | | | | | | | | | | | | | | | | | | | | | | | | | | | | | | | | | | | |
Table of Contents
UNAUDITED | | | | | | | | | | | | | | | | | | | | | | | | | | | | | For the Year Ended December 31, 2018 | (in thousands) | | PIRM | | UWS | | Corporate | | Elim | | CoreLogic | Net income/(loss) from continuing operations | | | $ | 102,725 | | | | $ | 238,424 | | | | $ | (218,698 | ) | | | $ | — | | | | $ | 122,451 | | Income taxes | | | | — | | | | | — | | | | | 46,187 | | | | | — | | | | | 46,187 | | Depreciation and amortization | | | | 103,343 | | | | | 65,381 | | | | | 23,272 | | | | | — | | | | | 191,996 | | Interest expense, net | | | | 735 | | | | | 305 | | | | | 72,934 | | | | | — | | | | | 73,974 | | Share-based compensation | | | | 5,421 | | | | | 7,885 | | | | | 23,890 | | | | | — | | | | | 37,196 | | Impairment loss | | | | — | | | | | 7,721 | | | | | — | | | | | — | | | | | 7,721 | | Non-operating gains | | | | (17,220 | ) | | | | — | | | | | (2,483 | ) | | | | — | | | | | (19,703 | ) | Efficiency investments | | | | 2,143 | | | | | 1,058 | | | | | 17,802 | | | | | — | | | | | 21,003 | | Transaction costs | | | | 6,559 | | | | | — | | | | | 4,792 | | | | | — | | | | | 11,351 | | Amortization of acquired intangibles included in equity in earnings of affiliates | | | | 909 | | | | | — | | | | | — | | | | | — | | | | | 909 | | Adjusted EBITDA | | | $ | 204,615 | | | | $ | 320,774 | | | | $ | (32,304 | ) | | | $ | — | | | | $ | 493,085 | |
| | | | | | | | | | | | | | | | | | | | | | | | | | | | | For the Year Ended December 31, 2017 | (in thousands) | | PIRM | | UWS | | Corporate | | Elim | | CoreLogic | Net income/(loss) from continuing operations | | | $ | 86,988 | | | | $ | 222,928 | | | | $ | (160,382 | ) | | | $ | — | | | | $ | 149,534 | | Income taxes | | | | — | | | | | — | | | | | 17,438 | | | | | — | | | | | 17,438 | | Depreciation and amortization | | | | 99,558 | | | | | 57,397 | | | | | 20,851 | | | | | — | | | | | 177,806 | | Interest expense, net | | | | 1,721 | | | | | 944 | | | | | 59,159 | | | | | — | | | | | 61,824 | | Share-based compensation | | | | 5,952 | | | | | 5,990 | | | | | 23,925 | | | | | — | | | | | 35,867 | | Non-operating losses | | | | 12,341 | | | | | 9,606 | | | | | 6,568 | | | | | — | | | | | 28,515 | | Efficiency investments | | | | — | | | | | 2,220 | | | | | 1,604 | | | | | — | | | | | 3,824 | | Transaction costs | | | | — | | | | | 779 | | | | | 3,747 | | | | | — | | | | | 4,526 | | Amortization of acquired intangibles included in equity in losses of affiliates | | | | 625 | | | | | 204 | | | | | — | | | | | — | | | | | 829 | | Adjusted EBITDA | | | $ | 207,185 | | | | $ | 300,068 | | | | $ | (27,090 | ) | | | $ | — | | | | $ | 480,163 | |
CORELOGIC, INC.
RECONCILIATION OF ADJUSTED EPS
UNAUDITED | | | | | | | | | | | | | | For the Year Ended December 31, | (diluted income per share) | | 2018 | | 2017 | Net income from continuing operations | | | $ | 1.49 | | | | $ | 1.75 | | Share-based compensation | | | | 0.45 | | | | | 0.42 | | Non-operating (gains)/losses | | | | (0.24 | ) | | | | 0.33 | | Efficiency investments | | | | 0.26 | | | | | 0.04 | | Impairment loss | | | | 0.09 | | | | | — | | Transaction costs | | | | 0.14 | | | | | 0.05 | | Depreciation and amortization of acquired software and intangibles | | | | 0.93 | | | | | 0.82 | | Amortization of acquired intangibles included in equity in earnings/(losses) of affiliates | | | | 0.01 | | | | | 0.01 | | Income tax effect on adjustments | | | | (0.41 | ) | | | | (1.05 | ) | Adjusted EPS | | | $ | 2.72 | | | | $ | 2.37 | |
| | | | | | | |
| | For the Year Ended December 31, | |
|---|
| | 2016 | | 2015 | |
|---|
Income from continuing operations, net of tax | | $ | 1.23 | | $ | 1.42 | | Stock-based compensation | | | 0.45 | | | 0.40 | | Non-operating losses/(gains) | | | 0.60 | | | (0.37 | ) | Efficiency investments | | | 0.02 | | | 0.08 | | Transaction costs | | | 0.08 | | | 0.06 | | Depreciation and amortization of acquired software and intangibles | | | 0.72 | | | 0.61 | | Amortization of acquired intangibles included in equity in earnings of affiliates | | | 0.03 | | | — | | Income tax effect on adjustments | | | (0.71 | ) | | (0.30 | ) | | | | | | | | | | Adjusted EPS | | $ | 2.42 | | $ | 1.90 | | | | | | | | | | | | | | | | | | | | | | | | | | | | |
CORELOGIC, INC.
RECONCILIATION TOOF FREE CASH FLOW
UNAUDITED | | | | | (in thousands)
| | For the Year Ended
December 31, 2016 | |
|---|
Net cash provided by operating activities — continuing operations | | $ | 414,003 | | Purchases of property and equipment | | | (45,211 | ) | Purchases of capitalized data and other intangible assets | | | (35,507 | ) | | | | | | | Free Cash Flow | | $ | 333,285 | | | | | | | | | | | | | | | | | | | |
| | | | | (in thousands)
| | For the Year Ended
December 31, 2015 | |
|---|
Net cash provided by operating activities — continuing operations | | $ | 336,149 | | Purchases of property and equipment | | | (44,149 | ) | Purchases of capitalized data and other intangible assets | | | (36,409 | ) | | | | | | | Free Cash Flow | | $ | 255,591 | | | | | | | | | | | | | | | | | | | |
Table of Contents
UNAUDITED | | | | | | (in thousands) | | For the Year Ended
December 31, 2018 | Net cash provided by operating activities — continuing operations | | | $ | 355,118 | | Purchases of property and equipment | | | | (62,304 | ) | Purchases of capitalized data and other intangible assets | | | | (35,075 | ) | Free cash flow | | | $ | 257,739 | |
| | | | | | (in thousands) | | For the Year Ended
December 31, 2017 | Net cash provided by operating activities — continuing operations | | | $ | 379,930 | | Purchases of property and equipment | | | | (40,508 | ) | Purchases of capitalized data and other intangible assets | | | | (34,990 | ) | Free cash flow | | | $ | 304,432 | |
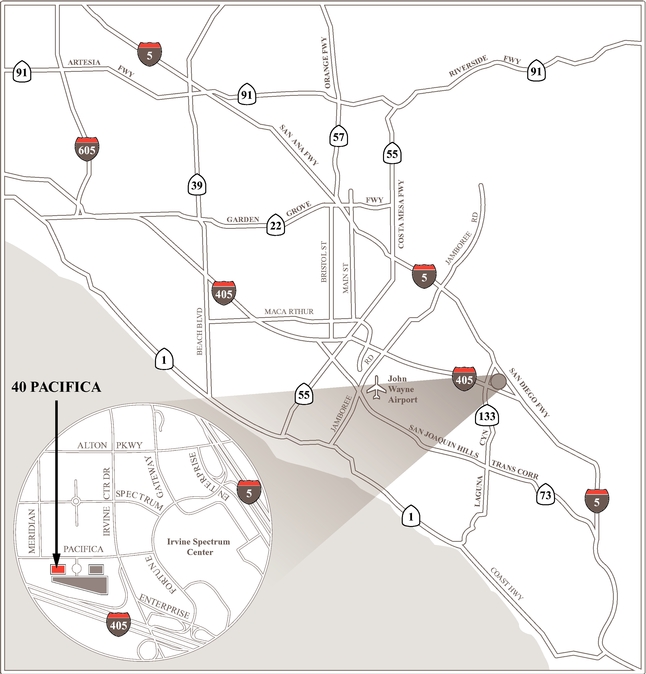
From San Diego: Takel-5 Take I-5 north, transactiontransition to I-405l-405 north. Exit Irvine Center Dr., keep to the left at the fork in the ramp. Turn left from the center lane on Enterprise, then turn right onto Irvine Center Dr. Take the first left onto Pacifica. Take the first left at the driveway between the two buildings. From Los Angeles: Takel-5 Take I-5 south, exit at Alton Pkwy., keeping to the right, to take the ramp at Alton; slight right onto Enterprise. Turn left onto Alton Pkwy. Turn left onto Irvine Center Dr., then take the second right onto Pacifica. 40 Pacifica is on the left. From Riverside: Take 91 west, transition to 55 south towards Newport Beach. Merge onto I-5l-5 south towards San Diego. Take the exit at Alton Pkwy., keeping to the right, to take the ramp at Alton; slight right onto Enterprise. Turn left onto Alton Pkwy. Turn left onto Irvine Center Dr., then take the second right onto Pacifica. 40 Pacifica is on the left. When you arrive, take a ticket and proceed into the parking garage. CoreLogic visitors parking is to the right.
29-PROXY2017-0317-00


40 Pacifica, Ste. 900
Irvine, CA 92618
corelogic.com | | | | 29-PROXY2019-0319-00 | | NYSE: CLGX | 29-PROXY2017-0217-00 | | © 20172019 CoreLogic, Inc. All rights reserved.
|
| | | | | 
| | 
|
ANNUAL MEETING OF STOCKHOLDERS May 3, 2017, 2:00 p.m. PacificTime
This proxy is solicited by CoreLogic’s Board of Directors.
|
| |
April 30, 2019, 2:00 p.m. Pacific Time This proxy is solicited by CoreLogic’s Board of Directors. The undersigned stockholder(s) of CoreLogic, Inc. hereby revoke(s) all previously granted proxies and appoint(s) Frank D. Martell and Stergios Theologides,Arnold A. Pinkston, and each of them, as proxies for the undersigned, with power to act without the other and with power to each of substitution, and hereby authorize(s) them to attend the annual meeting of the stockholders of said corporation to be held May 3, 2017,April 30, 2019, at 2:00 p.m. Pacific Time, at the executive offices of CoreLogic, Inc., 40 Pacifica, Irvine, California 92618, and any postponements or adjournments thereof, and to vote all of the shares of common stock of CoreLogic, Inc. that the undersigned is/are entitled to vote at such meeting as indicated on the reverse side hereof, with all powers that the undersigned would have if acting in person, and with discretionary authority to act on such other matters as may properly come before said meeting or any postponements or adjournments thereof. THE SHARES OF COMMON STOCK REPRESENTED HEREBY SHALL BE VOTED SPECIFICALLY ON THE PROPOSALS LISTED ON THE REVERSE SIDE HEREOF AS THERE SPECIFIED. WHERE NO SPECIFICATION IS MADE, SAID SHARES OF COMMON STOCK SHALL BE VOTED “FOR” EACH OF THE DIRECTOR NOMINEES NAMED IN PROPOSAL 1 AND “FOR” PROPOSALS 2 AND 4 AND “EVERY ONE YEAR” ON PROPOSAL 3. YOUR VOTE IS IMPORTANT – PLEASE VOTE TODAY | YOUR VOTE IS IMPORTANT – PLEASE VOTE TODAY
Continued and to be signed and dated on reverse side |
 PLEASE DETACH ALONG PERFORATED LINE AND MAIL IN THE ENVELOPE PROVIDED.
|
Important Notice Regarding the Availability of Proxy Materials for the Annual Meeting of Stockholders to be held May 3, 2017.April 30, 2019. The Notice of Annual Meeting and Proxy Statement and our 20162018 Annual Report to Stockholders are available at:http://www.viewproxy.com/CoreLogic/20172019
| | | | | TO VOTE BY MAIL AS THE BOARD OF DIRECTORS RECOMMENDS ON EACH OF THE ITEMS TO VOTE BY MAIL AS THE BOARD OF DIRECTORS RECOMMENDS ON EACH OF THE ITEMS BELOW,, SIMPLY SIMPLY SIGN,, DATE,, AND RETURN THIS PROXY CARD.The Board of Directors RecommendsRETURN THIS PROXY CARD. The Board of Directors Recommends a Vote FOR each of the Nominees in Proposal Vote FOR each of the Nominees in Proposal 1, FOR and FOR Proposals 2 and 4 and EVERY ONE YEAR on Proposal 3. | | Please mark
your votes
like this | | 
| | | |
| | | | | | | | | x1. Election of directors:
| | FOR | | AGAINST | | ABSTAIN | | | 01 J. David Chatham | | ☐ | | ☐ | | ☐ | | | 02 Douglas C. Curling | | ☐ | | ☐ | | ☐ | | | 03 John C. Dorman | | ☐ | | ☐ | | ☐ | | | 04 Paul F. Folino | | ☐ | | ☐ | | ☐ | | | 05 Frank D. Martell | | ☐ | | ☐ | | ☐ | | | 06 Claudia Fan Munce | | ☐ | | ☐ | | ☐ | | | 07 Thomas C. O’Brien | | ☐ | | ☐ | | ☐ | | | 08 Vikrant Raina | | ☐ | | ☐ | | ☐ | | | 09 Jaynie Miller Studenmund | | ☐ | | ☐ | | ☐ | | | 10 David F. Walker | | ☐ | | ☐ | | ☐ | | | 11 Mary Lee Widener | | ☐ | | ☐ | | ☐ | | |
1. Electionof directors:
2. | FOR
| AGAINST
| ABSTAIN
| | 2. To approve, on an advisory basis, the compensation of theCompany’s named executive officers.
oFORoAGAINSTo
|
☐ FOR ☐ AGAINST ☐ ABSTAIN | 3. | 3. To vote, on an advisory basis, on the frequency of future advisory votes on the compensation of the Company’s named executive officers.
o EVERY ONE YEAR o EVERY TWO YEARS
o EVERY THREE YEARS o ABSTAIN
4. To ratify the selection of PricewaterhouseCoopers LLP as the Company’s independent registered public accounting firm for the fiscal year ending December 31, 2017.2019.
oFORoAGAINSToABSTAIN
|
☐ FOR ☐ AGAINST ☐ ABSTAIN In their discretion, the proxies are authorized to vote upon such other business as may properly come before the meeting or any postponements or adjournments thereof. I plan on attending the meeting☐ Please sign exactly as your name(s) appears on this proxy card. If held in joint tenancy, all persons should sign. Trustees, administrators, etc. should include title and authority. Corporations should provide full name of corporation and title of authorized officer signing this proxy card. In their discretion, the proxies are authorized to vote upon such other business as may properly come before the meeting or any postponements or adjournments thereof.
| | | 01 J. David ChathamDate:
| o
| o
| o
| | 02 Douglas C. Curling
| o
| o
| o
| | 03 John C. Dorman
| o
| o
| o
| | 04 Paul F. Folino
| o
| o
| o
| | 05 Frank D. Martell
| o
| o
| o
| | 06 Thomas C. O’Brien
| o
| o
| o
| | 07 Jaynie Miller Studenmund
| o
| o
| o
| | 08 David F. Walker
| o
| o
| o
| | 09 Mary Lee Widener
| o
| o
| o
| | | Signature | | | | | | | | | | | | | | | | | | | | | | | | I plan on attending the meeting
| o
| | | | | | | Please sign exactly as your name(s) appears on this proxy card. IfSignature (if held in joint tenancy, all persons should sign. Trustees, administrators, etc. should include title and authority. Corporations should provide full name of corporation and title of authorized officer signing this proxy card.
| | | | | | Date:
| | | | | | | | | | | | Signature
| | | | | | | | | | | | Signature (if held jointly)
| | | | | | | | | | | | |
PLEASE DETACH ALONG PERFORATED LINE AND MAIL IN THE ENVELOPE PROVIDED.
|

▲PLEASE DETACH ALONG PERFORATED LINE AND MAIL IN THE ENVELOPE PROVIDED.▲ Vote by Internet, Telephone or Mail 24 Hours a Day, 7 Days a Week 
CONTROL NUMBER

PROXY VOTING INSTRUCTIONS Please have your 11 digit control number ready when voting by Internet or Telephone. Internet and telephone voting is available through 11:59 P.M. Eastern Daylight Time on May 2, 2017. April 29, 2019. | | | | | | | | | | | | | |  | | | |  | | | |  | | INTERNET | | | | TELEPHONE | | | |  INTERNETMAIL
| Vote Your Proxy on the Internet:
Go to www.AALvote.com/CLGX
Go towww.AALvote.com/CLGX | | | | Vote Your Proxy by Phone: Call 1 (866)804-9616 | | | | Vote Your Proxy by Mail: | | Have your proxy card available when you access the above website. Follow the prompts to vote your shares. | | 
TELEPHONE
Vote Your Proxy by Phone:
Call 1 (866) 804-9616
| | Use any touch-tone telephone to vote your proxy. Have your proxy card available when you call. Follow the voting instructions to vote your shares. | | 
MAIL
Vote Your Proxy by Mail:
| | Mark, sign, and date your proxy card, then detach it, and return it in the postage-paid envelope provided. | |
If you vote your proxy by Internet or by Telephone, you do NOT need to mail back your proxy card.
|
|
|